

Robust inference in discrete hazard models for randomized clinical trials
- PMID: 22810273
- PMCID: PMC3440522
- DOI: 10.1007/s10985-012-9224-6
Robust inference in discrete hazard models for randomized clinical trials
Abstract
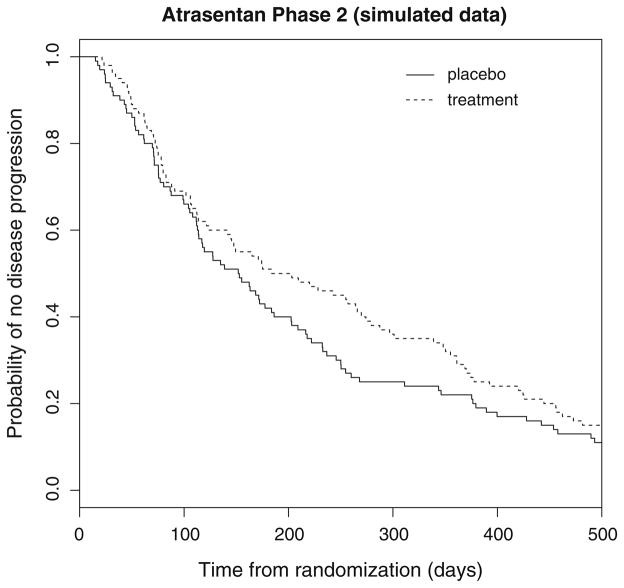
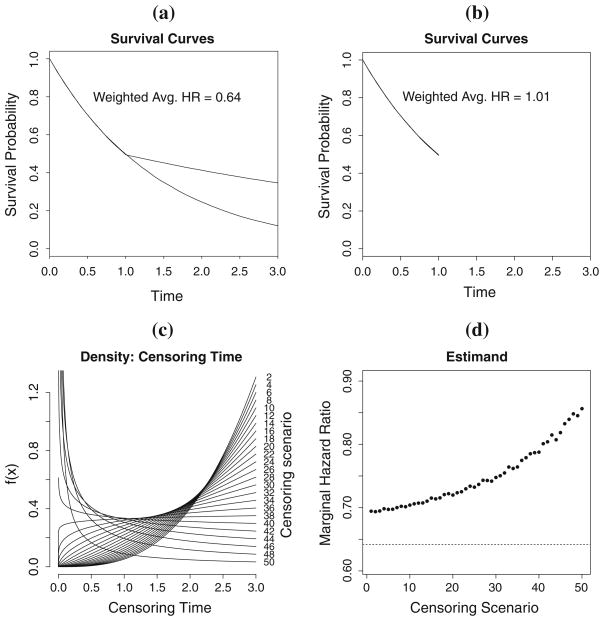
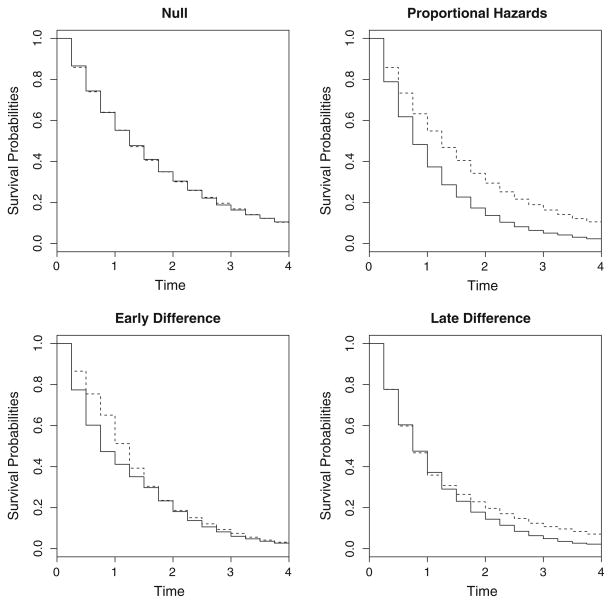
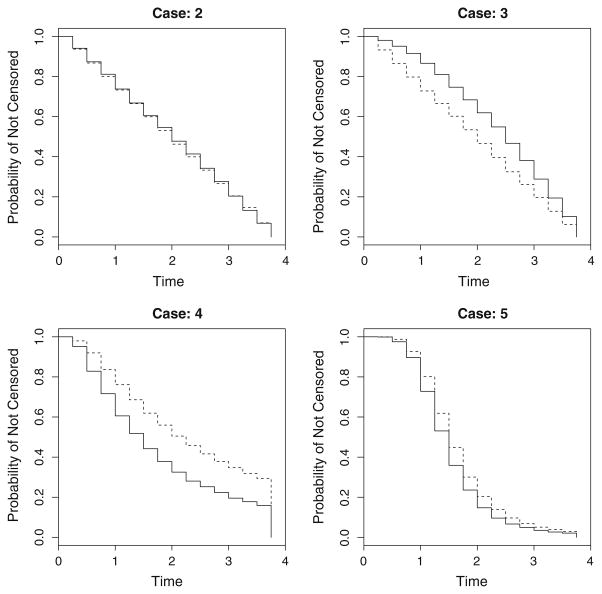
Time-to-event data in which failures are only assessed at discrete time points are common in many clinical trials. Examples include oncology studies where events are observed through periodic screenings such as radiographic scans. When the survival endpoint is acknowledged to be discrete, common methods for the analysis of observed failure times include the discrete hazard models (e.g., the discrete-time proportional hazards and the continuation ratio model) and the proportional odds model. In this manuscript, we consider estimation of a marginal treatment effect in discrete hazard models where the constant treatment effect assumption is violated. We demonstrate that the estimator resulting from these discrete hazard models is consistent for a parameter that depends on the underlying censoring distribution. An estimator that removes the dependence on the censoring mechanism is proposed and its asymptotic distribution is derived. Basing inference on the proposed estimator allows for statistical inference that is scientifically meaningful and reproducible. Simulation is used to assess the performance of the presented methodology in finite samples.
Figures
Similar articles
-
Estimation of treatment effect under non-proportional hazards and conditionally independent censoring.Stat Med. 2012 Dec 10;31(28):3504-15. doi: 10.1002/sim.5440. Epub 2012 Jul 4. Stat Med. 2012. PMID: 22763957 Free PMC article.
-
Estimation of treatment effects based on possibly misspecified Cox regression.Lifetime Data Anal. 2012 Oct;18(4):408-33. doi: 10.1007/s10985-012-9222-8. Epub 2012 Apr 21. Lifetime Data Anal. 2012. PMID: 22527680
-
Improved precision in the analysis of randomized trials with survival outcomes, without assuming proportional hazards.Lifetime Data Anal. 2019 Jul;25(3):439-468. doi: 10.1007/s10985-018-9428-5. Epub 2018 Feb 28. Lifetime Data Anal. 2019. PMID: 29492746
-
Are non-constant rates and non-proportional treatment effects accounted for in the design and analysis of randomised controlled trials? A review of current practice.BMC Med Res Methodol. 2019 May 16;19(1):103. doi: 10.1186/s12874-019-0749-1. BMC Med Res Methodol. 2019. PMID: 31096924 Free PMC article. Review.
-
Hazards Constitute Key Quantities for Analyzing, Interpreting and Understanding Time-to-Event Data.Biom J. 2025 Jun;67(3):e70057. doi: 10.1002/bimj.70057. Biom J. 2025. PMID: 40474657 Free PMC article. Review.
Cited by
-
Statistical Issues and Recommendations for Clinical Trials Conducted During the COVID-19 Pandemic.Stat Biopharm Res. 2020 Jul 6;12(4):399-411. doi: 10.1080/19466315.2020.1779122. Stat Biopharm Res. 2020. PMID: 34191971 Free PMC article.
-
Causal interpretation of the hazard ratio in randomized clinical trials.Clin Trials. 2024 Oct;21(5):623-635. doi: 10.1177/17407745241243308. Epub 2024 Apr 28. Clin Trials. 2024. PMID: 38679930 Free PMC article.
-
Proportional exponentiated link transformed hazards (ELTH) models for discrete time survival data with application.Lifetime Data Anal. 2016 Jan;22(1):38-62. doi: 10.1007/s10985-015-9326-z. Epub 2015 Mar 15. Lifetime Data Anal. 2016. PMID: 25772374 Free PMC article.
-
Censoring-robust estimation in observational survival studies: Assessing the relative effectiveness of vascular access type on patency among end-stage renal disease patients.Stat Biosci. 2017 Dec;9(2):406-430. doi: 10.1007/s12561-016-9162-z. Epub 2016 Aug 18. Stat Biosci. 2017. PMID: 32190128 Free PMC article.
References
-
- Abbott Laboratories. Oncologic drugs advisory committee: briefing document for atrasentan (Xinlay™) 2005 URL: http://www.fda.gov/ohrms/dockets/ac/05/briefing/2005-4174B1_01_01-Abbott....
-
- Bennett S. Analysis of survival data by the proportional odds model. Stat Med. 1983;2:273–277. - PubMed
-
- Berridge DM, Whitehead J. Analysis of failure time data with ordinal categories of response. Stat Med. 1991;10:1703–1710. - PubMed
-
- Breslow N. Covariance analysis of censored survival data. Biometrics. 1974;30:89–99. - PubMed
Publication types
MeSH terms
Grants and funding
LinkOut - more resources
Full Text Sources
Medical
