. 2012 Oct;124(4):547-60.
doi: 10.1007/s00401-012-1016-2. Epub 2012 Jul 19.

MGMT methylation analysis of glioblastoma on the Infinium methylation BeadChip identifies two distinct CpG regions associated with gene silencing and outcome, yielding a prediction model for comparisons across datasets, tumor grades, and CIMP-status

Affiliations

MGMT methylation analysis of glioblastoma on the Infinium methylation BeadChip identifies two distinct CpG regions associated with gene silencing and outcome, yielding a prediction model for comparisons across datasets, tumor grades, and CIMP-status

Pierre Bady et al. Acta Neuropathol. 2012 Oct.

Erratum in

  • Acta Neuropathol. 2013 Jul;126(1):159

Abstract

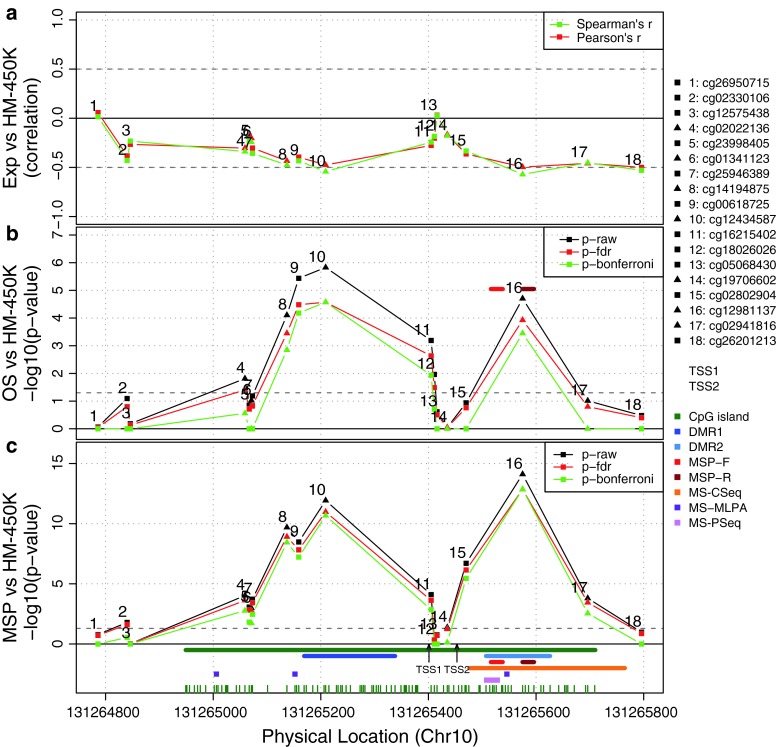
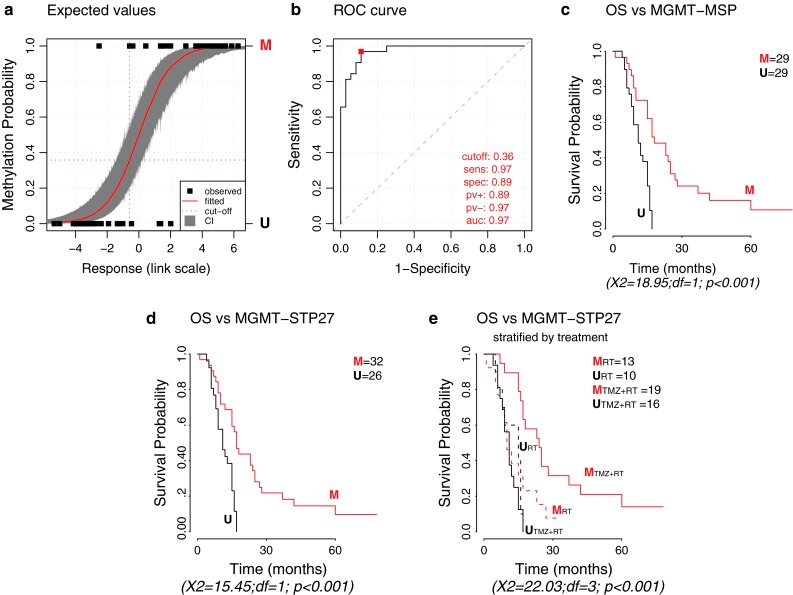
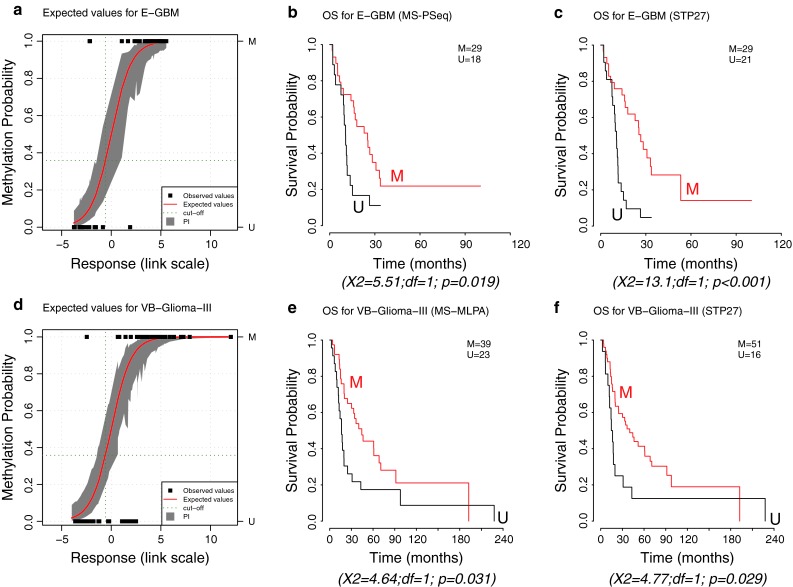
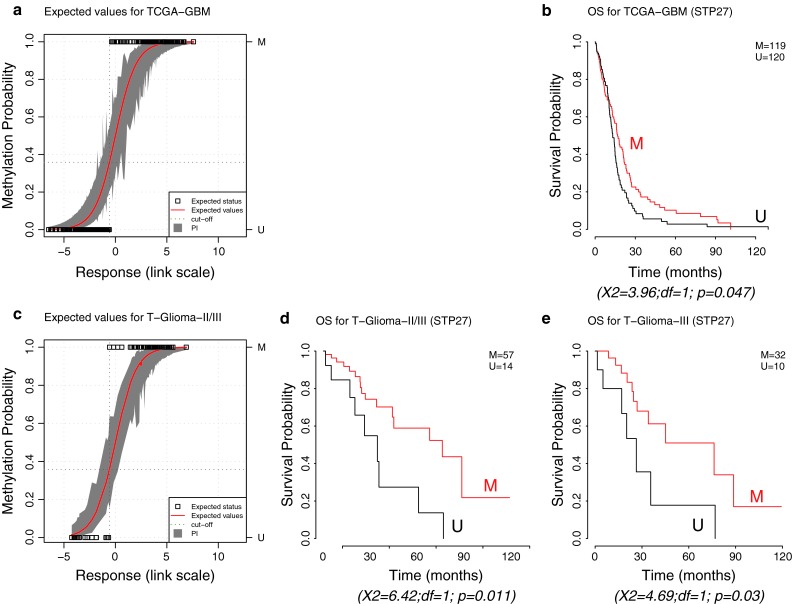
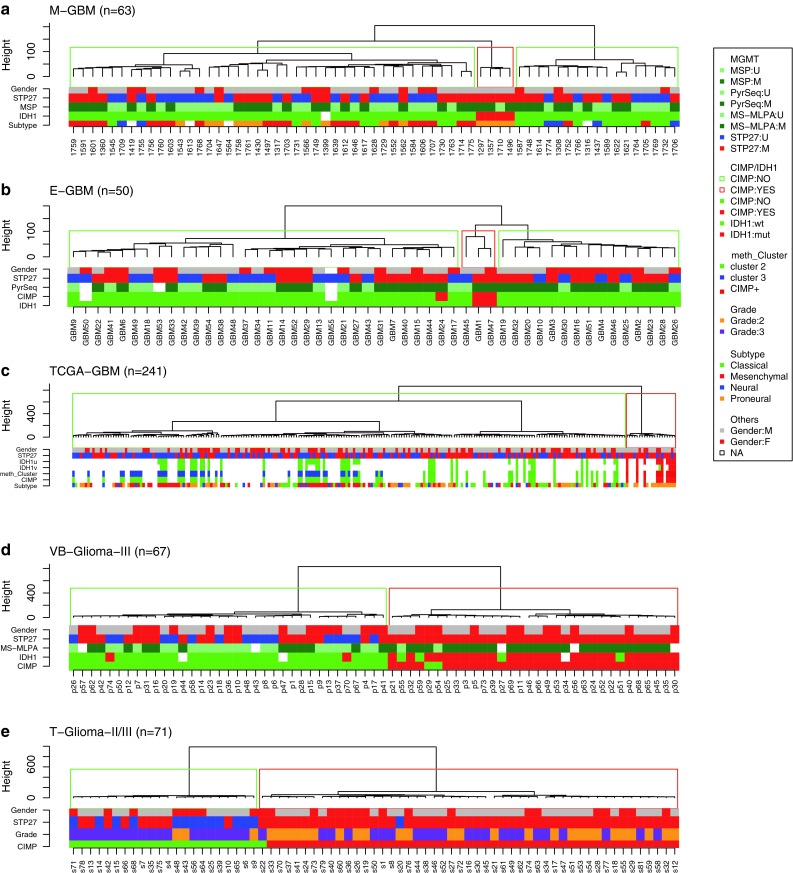
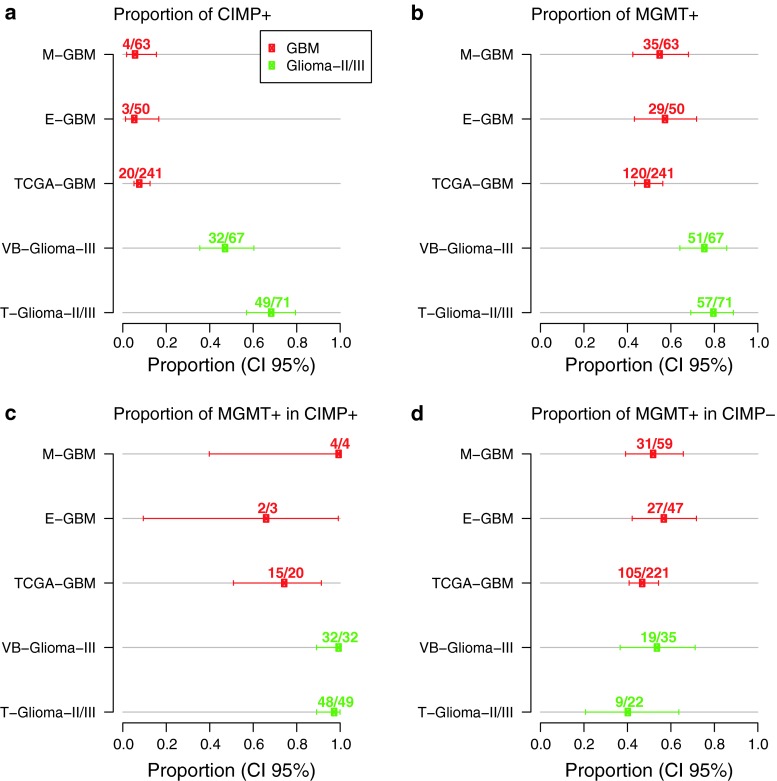
The methylation status of the O(6)-methylguanine-DNA methyltransferase (MGMT) gene is an important predictive biomarker for benefit from alkylating agent therapy in glioblastoma. Recent studies in anaplastic glioma suggest a prognostic value for MGMT methylation. Investigation of pathogenetic and epigenetic features of this intriguingly distinct behavior requires accurate MGMT classification to assess high throughput molecular databases. Promoter methylation-mediated gene silencing is strongly dependent on the location of the methylated CpGs, complicating classification. Using the HumanMethylation450 (HM-450K) BeadChip interrogating 176 CpGs annotated for the MGMT gene, with 14 located in the promoter, two distinct regions in the CpG island of the promoter were identified with high importance for gene silencing and outcome prediction. A logistic regression model (MGMT-STP27) comprising probes cg12434587 [corrected] and cg12981137 provided good classification properties and prognostic value (kappa = 0.85; log-rank p < 0.001) using a training-set of 63 glioblastomas from homogenously treated patients, for whom MGMT methylation was previously shown to be predictive for outcome based on classification by methylation-specific PCR. MGMT-STP27 was successfully validated in an independent cohort of chemo-radiotherapy-treated glioblastoma patients (n = 50; kappa = 0.88; outcome, log-rank p < 0.001). Lower prevalence of MGMT methylation among CpG island methylator phenotype (CIMP) positive tumors was found in glioblastomas from The Cancer Genome Atlas than in low grade and anaplastic glioma cohorts, while in CIMP-negative gliomas MGMT was classified as methylated in approximately 50 % regardless of tumor grade. The proposed MGMT-STP27 prediction model allows mining of datasets derived on the HM-450K or HM-27K BeadChip to explore effects of distinct epigenetic context of MGMT methylation suspected to modulate treatment resistance in different tumor types.


Figures

Fig. 1
Fig. 1
CpG methylation of the MGMT promoter region, MGMT expression and patient survival in M-GBM. a The Spearman and Pearson correlations between gene expression (probe 204880_at from Affymetrix U133plus2) and M-value of the 18 CpG methylation probes from the Infinium humanmethyltion 450K BeadChip (HM-450K) of the M-GBM cohort are visualized on a scale representing the physical location in the CpG island of the promoter region encompassing the transcription start site (TSS) (genome build 37). b The associations between overall survival (OS) and CpG methylation of distinct probes are displayed (p values, univariate Cox regression model and log-likelihood ratio test; p values, minus-log10-transformed). The p value for classification by MSP is indicated at its physical location (primer set, red). c The associations between MGMT promoter methylation classification based on MSP and the 18 selected CpG methylation probes from the HM-450K are shown (logistic regression and log-likelihood ratio test; p values, minus-log10-transformed). The dotted gray lines in b and c correspond to the threshold of 0.05. The graph at the bottom indicates the physical location of the TSS (TSS1, according to Harris et al. [14]; TSS2 according to gene build 19); the location of the CpG island/individual CpGs green; the differentially methylated regions 1 and 2, DMR1 and 2, as defined by Malley et al. [23] blue; the primers for MSP [6] red; the region for MS-clone sequencing in glioblastoma, MS-CSeq [34]; the CpGs interrogated by methylation specific multiplex ligation-dependent probe amplification, MS-MPLA purple [44], and methylation-specific pyrosequencing, MS-PSeq pink [7]. The names of the CpG probes interrogated on HM-450K are given on the right. Probes present on both platforms (HM-450K and HM-27K) are indicated by triangles, probes only present on the HM-450K are represented by squares. See supplementary Figure S1 for exact locations of CpGs interrogated by the different assays. The symbols are explained on the right hand side. We note that the CpG methylation probes (8, 9, 10 and 16) most correlated with expression also correspond to the probes highly associated with survival, and most correlated with MSP-based MGMT methylation prediction
Fig. 2
Fig. 2
Performance of the stepwise logistic regression model (MGMT-STP27) for prediction of methylation status of the MGMT promoter. a Displays the estimated probability of methylation against the logit-transformed response fitted for the M-GBM dataset. The observed values are given by full black squares, indicating same or different classification by STP27 or MSP. Fitted values and their confidence intervals [CI] at 95 %, estimated by simulation, correspond to the red line and gray area, respectively. Dark green dotted lines indicate the threshold used to define methylated and unmethylated samples. b The receiver operating characteristic (ROC) curve is provided, where sensitivity (true positive rate) is plotted against 1-specificity (false positive rate). Accuracy is measured by the area under the ROC curve (AUC). Performance criteria are given for the optimal cut-off below the curve: optimal cut-off, sensitivity (sens), specificity (spec), positive predictive value (pv+), negative predictive value (pv−) and area under the curve (auc). The Kaplan–Meier curves for 58 patients are displayed for MSP-based classification (c) for the predicted methylation status obtained by the MGMT-STP27 model (d), and with additional stratification by treatment arm (RT + TMZ or RT treatment arm) (e) to visualize the predictive value of MGMT methylation for benefit from TMZ. Results of log-rank tests are given below each survival representation. M methylated, U unmethylated
Fig. 3
Fig. 3
Validation of MGMT-STP27 in external datasets. The plots a and d represent the estimated probability of methylation against logit-transformed response fitted for the E-GBM, and VB-Glioma-III datasets using STP27. Fitted values and their prediction intervals [PI] at 95 %, estimated by simulation, correspond to the red line and gray area, respectively. Dark green dotted lines indicate the threshold used to define methylated and unmethylated samples according to STP27. The observed values are visualized by full black squares, indicating same or different classification by STP27 or MS-PSeq for E-GBM and MS-MLPA test for VB-Glioma-III, respectively. The Kaplan–Meier curves are based on classification by MS-PSeq for E-GBM (b), the MS-MLPA test for VB-Glioma-III (e), and based on the respective predicted methylation status using MGMT-STP27, in (c, f). Results of log-rank tests are given below each survival representation. M methylated, U unmethylated
Fig. 4
Fig. 4
MGMT-STP27 based prediction in external datasets. The first plots in (a) and (c) represent the estimated values (probability of methylation fitted against response fitted in link space) for the GBM-TCGA and T-Glioma-II/III datasets. Fitted values and their prediction intervals [PI] at 95 %, estimated by simulation, correspond to the red line and gray area, respectively. Dark green dotted lines indicate the threshold used to define methylated and unmethylated samples. The white squares correspond to the deduced methylation status. The Kaplan–Meier curves are based on classification by prediction using MGMT-STP27 for TCGA-GBM (b), T-Glioma II/III (d), or only T-Glioma-III (e), Results of log-rank tests are given below each survival representation. M methylated, U unmethylated
Fig. 5
Fig. 5
Distribution of MGMT methylation and CIMP status. The dendrogram for each dataset is provided. The five datasets were centered and normalized by probes followed by unsupervised hierarchical classifications of the 1,000 most variable probes (autosomes only) using Ward’s algorithm and Euclidean distance to establish CIMP classification (green rectangle for non-CIMP and red for CIMP). The methylation status of the MGMT promoter predicted by MGMT-STP27, blue for unmethylated, and red for methylated, is provided as label. Sample description comprise CIMP status as established in the respective original publication (if available), gender, IDH1 status (mutated or not, with additional annotation for TCGA-GBM; u unvalidated; v validated), classification into methylation clusters according to Noushmehr et al. [29] (cluster annotation Level 4 data, TCGA data portal), and gene expression based glioblastoma classification using a modified model from Verhaak et al. [48], tumor grade (for T-Glioma-II/III), and methylation status of MGMT promoter based on MSP, MS-MLPA, and MS-PSeq, unmethylated, light green; methylated, darkgreen. The color code for the labels is displayed
Fig. 6
Fig. 6
Proportion of predicted MGMT promoter methylation in CIMP+ or CIMP− gliomas. For all five glioma datasets, the proportion of CIMP+ (a), the proportion of MGMT methylation (b), and the proportion of MGMT methylation in CIMP+ (c) and CIMP− (d) tumors, respectively, are given. The CIMP status and the MGMT promoter methylation status are derived from unsupervised classification and MGMT-STP27, respectively

References

    1. Burnham KP, Anderson DR. Model selection and multimodel inference: a practical information theoretic approach. New York: Springer-Verlag; 2002.
    1. Collett D. Modelling binary data. London: Chapman & Hall/CRC; 2002.
    1. Criniere E, Kaloshi G, Laigle-Donadey F, et al. MGMT prognostic impact on glioblastoma is dependent on therapeutic modalities. J Neurooncol. 2007;83:173–179. doi: 10.1007/s11060-006-9320-0. - DOI - PubMed
    1. Du P, Zhang X, Huang CC, et al. Comparison of Beta-value and M-value methods for quantifying methylation levels by microarray analysis. BMC Bioinformatics. 2010;11:587. doi: 10.1186/1471-2105-11-587. - DOI - PMC - PubMed
    1. Esteller M, Garcia-Foncillas J, Andion E, et al. Inactivation of the DNA-repair gene MGMT and the clinical response of gliomas to alkylating agents. N Engl J Med. 2000;343:1350–1354. doi: 10.1056/NEJM200011093431901. - DOI - PubMed

Publication types

MeSH terms