. 2012 Aug 1;26(15):1743-57.
doi: 10.1101/gad.191593.112. Epub 2012 Jul 18.

Neocortical dendritic complexity is controlled during development by NOMA-GAP-dependent inhibition of Cdc42 and activation of cofilin

Affiliations

Neocortical dendritic complexity is controlled during development by NOMA-GAP-dependent inhibition of Cdc42 and activation of cofilin

Marta Rosário et al. Genes Dev. .

Abstract

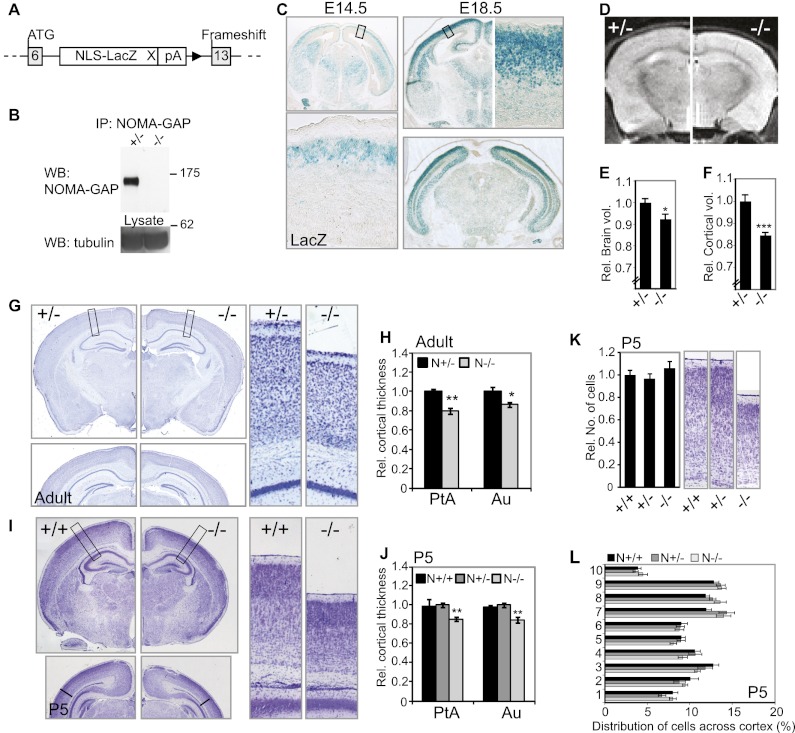
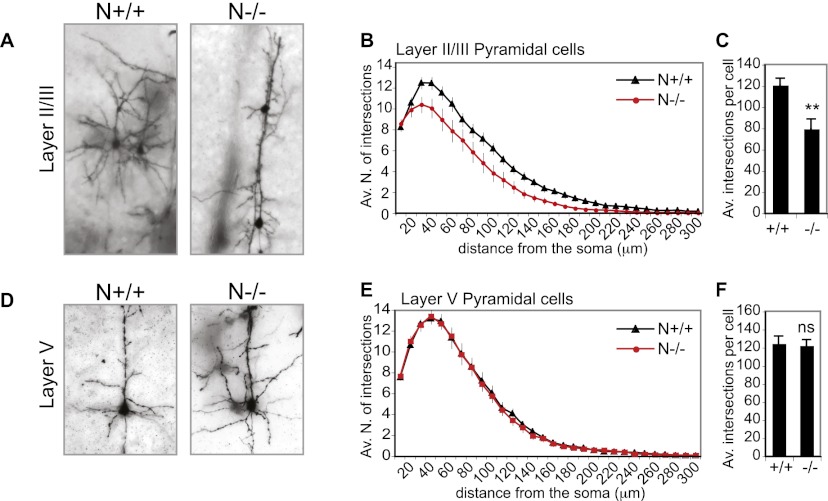
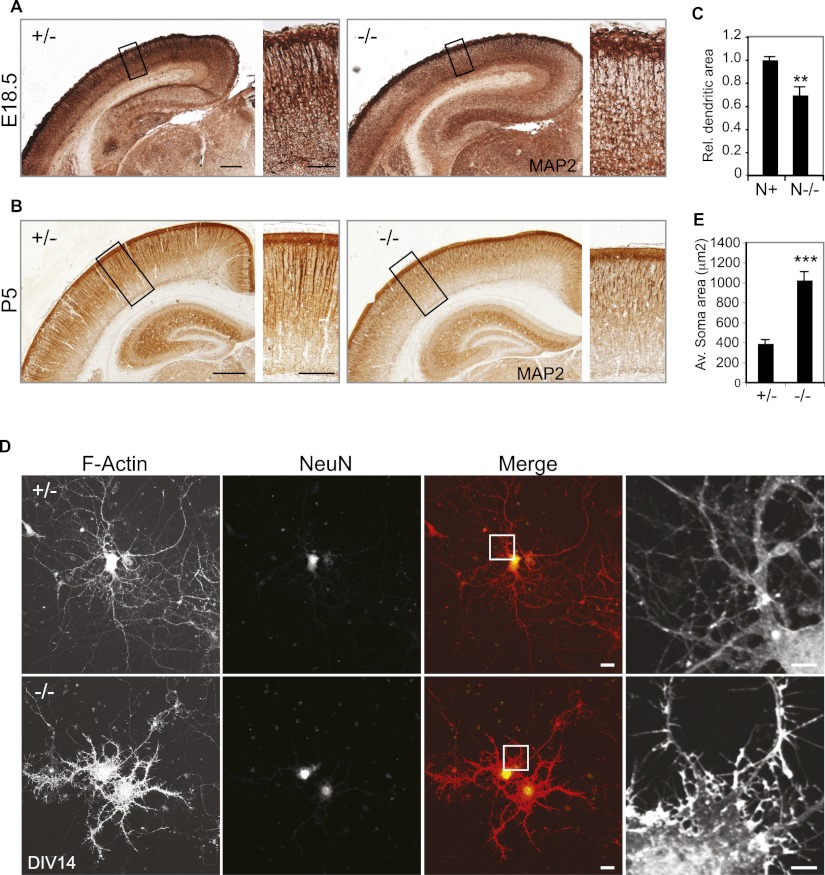
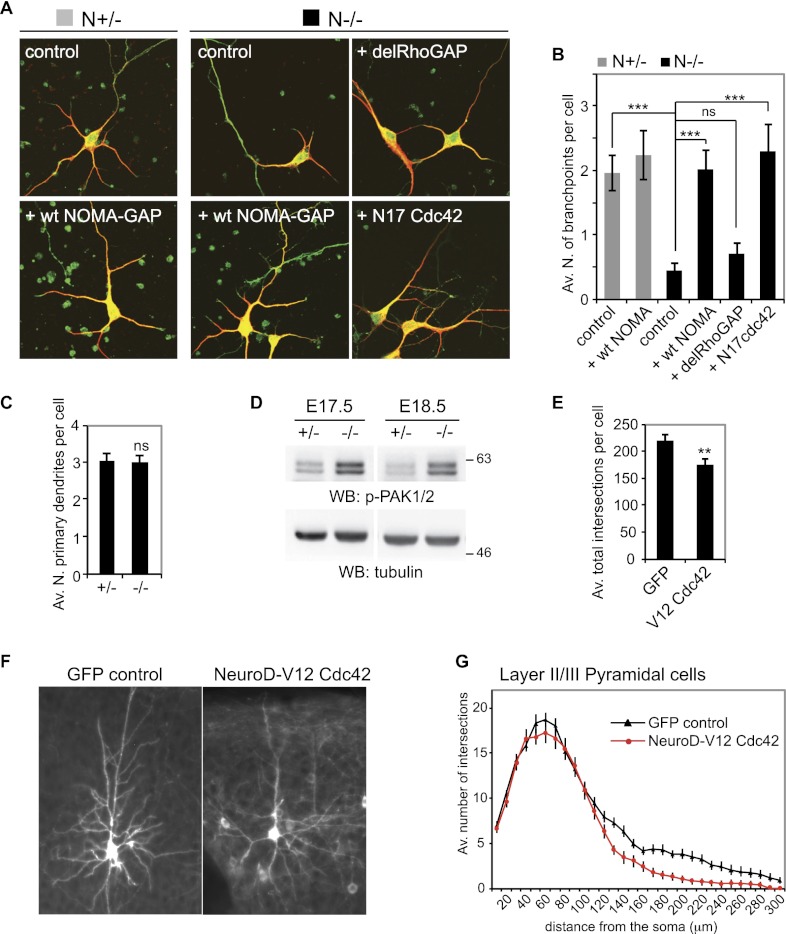
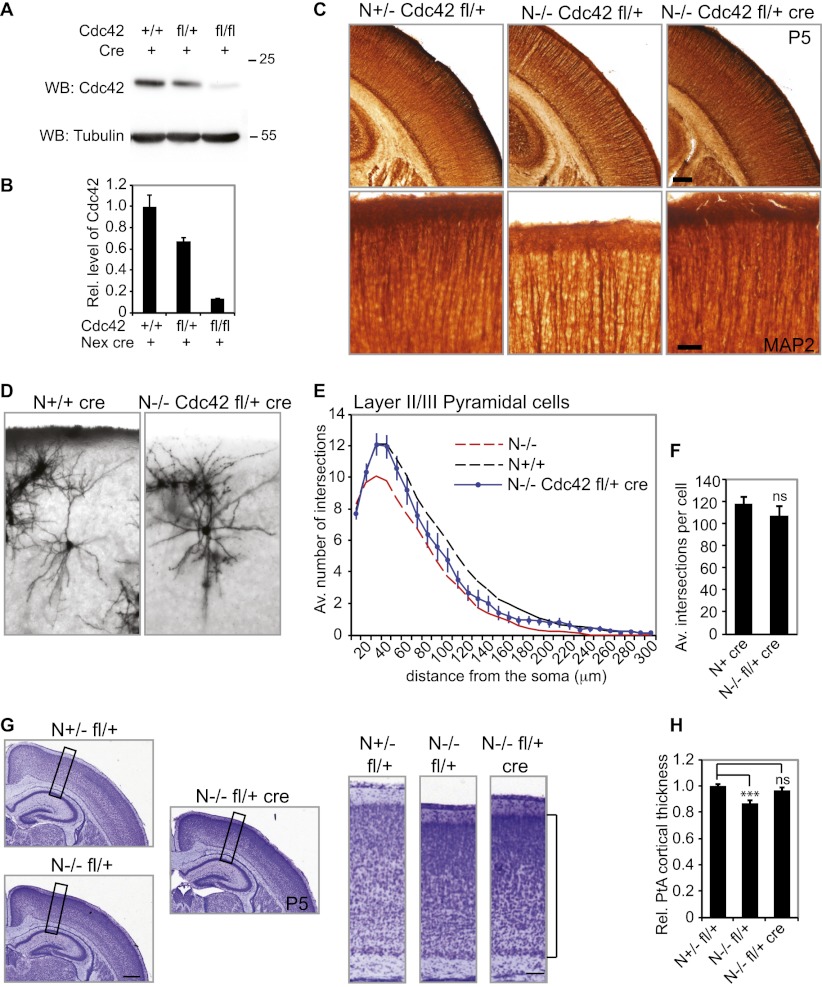
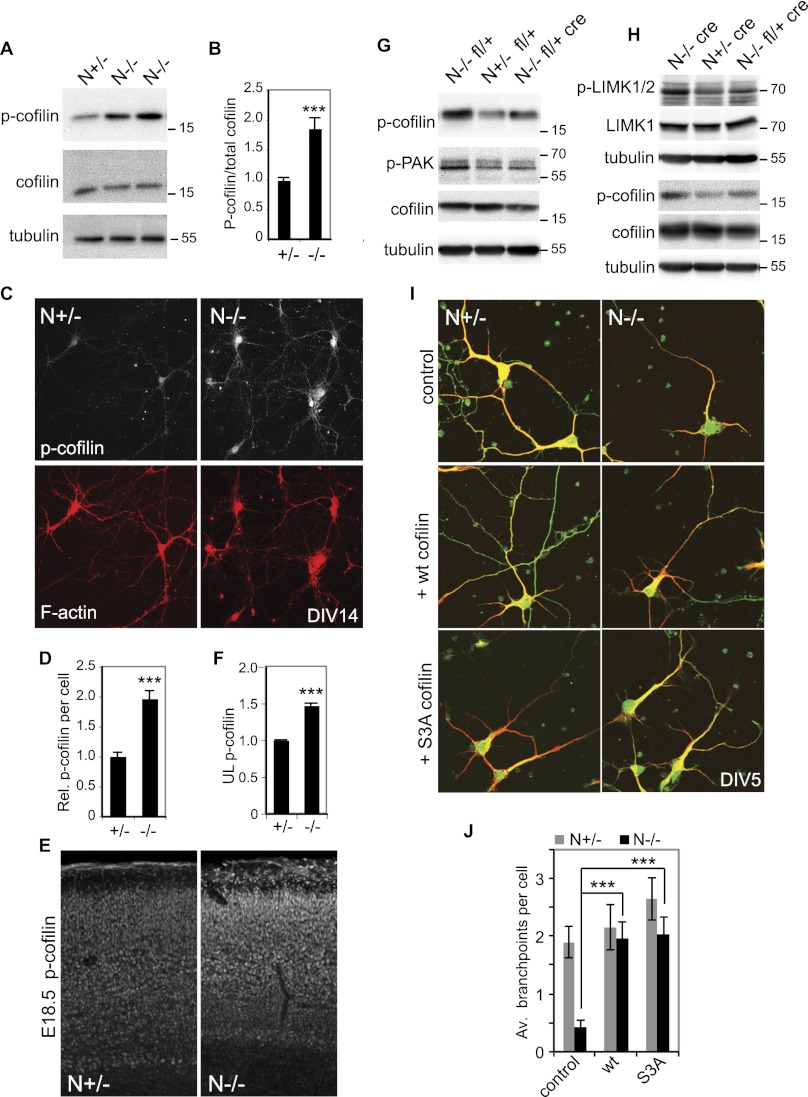
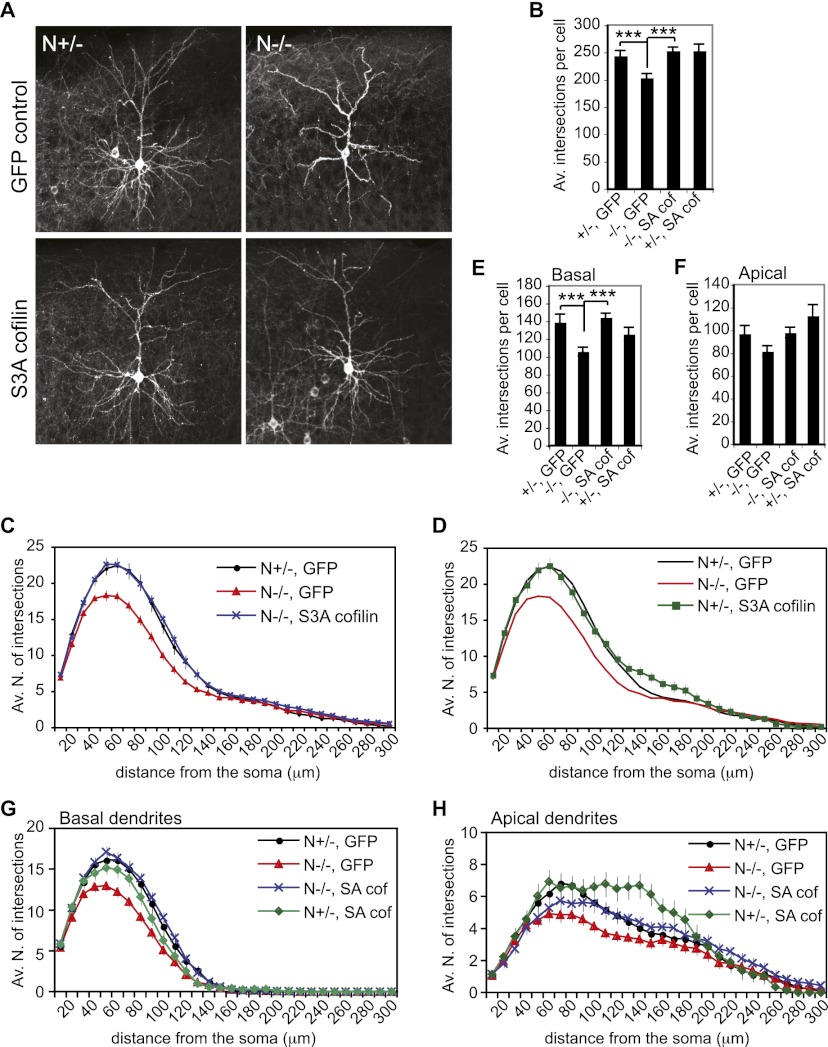
Neocortical neurons have highly branched dendritic trees that are essential for their function. Indeed, defects in dendritic arborization are associated with human neurodevelopmental disorders. The molecular mechanisms regulating dendritic arbor complexity, however, are still poorly understood. Here, we uncover the molecular basis for the regulation of dendritic branching during cortical development. We show that during development, dendritic branching requires post-mitotic suppression of the RhoGTPase Cdc42. By generating genetically modified mice, we demonstrate that this is catalyzed in vivo by the novel Cdc42-GAP NOMA-GAP. Loss of NOMA-GAP leads to decreased neocortical volume, associated specifically with profound oversimplification of cortical dendritic arborization and hyperactivation of Cdc42. Remarkably, dendritic complexity and cortical thickness can be partially restored by genetic reduction of post-mitotic Cdc42 levels. Furthermore, we identify the actin regulator cofilin as a key regulator of dendritic complexity in vivo. Cofilin activation during late cortical development depends on NOMA-GAP expression and subsequent inhibition of Cdc42. Strikingly, in utero expression of active cofilin is sufficient to restore postnatal dendritic complexity in NOMA-GAP-deficient animals. Our findings define a novel cell-intrinsic mechanism to regulate dendritic branching and thus neuronal complexity in the cerebral cortex.


Figures

Figure 1.
Figure 1.
Loss of NOMA-GAP leads to cortical thinning. (A) Schema of the targeted NOMA-GAP gene generated. Exons 7–12 of the murine gene encoding NOMA-GAP were replaced with a nuclear-localized β-gal gene. For details, refer to Supplemental Figure 1A. (B) Deletion of exons 7–12 results in loss of NOMA-GAP expression. NOMA-GAP was immunoprecipitated from heterozygote (+/−) and mutant (−/−) whole-brain extracts derived from P0 littermate animals and was detected using an antibody against the C terminus of NOMA-GAP. (C) NOMA-GAP is expressed in the cortical plate but is absent from the progenitor zone during cortical development. Analysis of LacZ reporter activity in coronal sections of E14.5 and E18.5 N+/− embryos. (D) MRI of brains of living NOMA-GAP-deficient adult animals shows cortical thinning but no alteration in overall brain structure. (E) Quantification of the average total brain volume per animal derived from analysis of 500-μm-spaced MRI scans. n = 5 N−/− and 4 N+/−; P = 0.03. (F) Quantification of total cortical volume of adult mouse brains. P = 0.0008. (G,H) Adult N−/− mice have a thinner cortex. The thickness of different cortical regions was determined from 40-μm Nissl-stained coronal sections of adult mouse brains. Representative images of the Nissl-stained sections used are shown in G. Magnifications are shown in the right panels. The relative thickness of the parietal (PtA) and auditory (Au) cortex is shown in H. Student's t-tests were used to compare N+/− and N−/− animals. PPtA = 0.002; PAu = 0.02; n = 9. Additional measured regions are shown in Supplemental Figure 1I. (I,J) Newborn NOMA-GAP-deficient mice have thinner cortices. The relative thickness of different cortical regions was determined for P5 mice using matched Nissl-stained 10-μm coronal sections of littermate animals. n = 4 N−/−, 5 N+/−, and 2 N+/+; PPtA = 0.0026, PAu = 0.004. Representative images of the sections used for quantification are shown in I. The relative thickness of the parietal (PtA) and auditory (Au) cortex is shown in J. (K,L) Loss of NOMA-GAP does not affect the number or distribution of cells in the somatosensory cortex of newborn mice. (K) The relative number of cortical cells in the barrel field region of the primary somatosensory cortex of P5 animals was determined. n = 3 N+/+, 3 N+/−, and 4 N−/− animals; PANOVA = 0.5. Representative images of the sections used for counting are shown in the right panels. (L) Distribution of cells across the cortex at P5. The cortex was divided into 10 equal-sized bins, and the proportion of cells in each bin was determined. Layer II/III corresponds to bins 8–9. PANOVA = 0.4 ± 0.25 across measured bins.
Figure 2.
Figure 2.
NOMA-GAP regulates dendritic complexity in vivo. (AC) Loss of NOMA-GAP severely reduces the dendritic complexity of upper-layer cortical neurons. (A) Golgi staining of P25–P26 animals shows decreased dendritic arborization in N−/− upper-layer neurons. Representative average projections of Z-stack images of Golgi-stained upper-layer somatosensory cortex neurons are shown. The Z-stack images of these and other examples are available in the Supplemental Material (Supplemental Movies 1, 2). (B) Sholl analysis of Golgi-stained wild-type and NOMA-GAP-deficient layer II/III pyramidal neurons shows a reduction in dendritic complexity upon loss of NOMA-GAP. The average number of total intersections per cell are shown in C. n = 64 N+/+ and 36 N−/− cells from five and four independent animals, respectively; P = 0.004. (DF) Sholl analysis of layer V neurons shows no significant difference in the complexity of NOMA-GAP mutant and wild-type neurons to a distance of 300 μm. Golgi-stained layer V neurons are shown in D. The Sholl profiles and average total intersections per cell for layer V neurons are shown in E and F, respectively. n = 37 N+/+ and 33 N−/− cells from four and three independent animals, respectively; P = 0.8.
Figure 3.
Figure 3.
NOMA-GAP regulates dendritic development. (A,B) Loss of NOMA-GAP reduces cortical MAP2 staining. MAP2 staining (brown) in 10-μm coronal sections of littermate E18.5 (A) and P5 (B) brains is shown. Magnifications of the upper cortical layers are shown on the right. Bars: A, 200 μm, 50 μm B, 500 μm, 200 μm. (C) Quantification of the relative dendritic area in the upper layer of P4–P5 animals. n = 5 N+ and 4 N−/− animals; P = 0.0018. (D,E) Loss of NOMA-GAP induces morphological changes and loss of dendritic complexity in mature primary cortical neurons at DIV14. Staining for F-actin (red) and the neuronal marker NeuN (green) is shown for cells derived from littermate N+/− and N−/− E16.5 embryos. Bar, 20 μm. Magnification of the F-actin staining is shown on the right. Bar, 5 μm. (E) The somal area is significantly increased in DIV14 N−/− neurons. n = 21 N+/− and 31 N−/− cells; P = 1.7 × 10⁻⁸.
Figure 4.
Figure 4.
NOMA-GAP is a major negative regulator of Cdc42. (A,B) NOMA-GAP regulates dendritic branching through Cdc42. Cortical cells derived from N−/− or N+/− littermate embryos were transfected at DIV1 with control empty vector or the indicated expression constructs. Staining for MAP2 (red) and the GFP transfection marker (green) at DIV5 is shown in A. The average number of branchpoints per cell for a representative experiment is shown in B. n = 30, 30, 32, 32, 31, and 39 cells for the conditions from left to right; PANOVA = 5 × 10⁻⁸; PN+/− vs. N−/− = 4 × 10⁻⁶ ; PN−/− vs. N−/− wt = 1 × 10⁻⁶; PN−/− vs. N−/− del = 0.2; PN−/− vs. N−/− N17 = 2 × 10⁻⁵. (C) The number of primary dendrites per cell is not affected by loss of NOMA-GAP. Quantification was carried out using DIV5 cells derived from littermate animals. n = 29 N+/− and 31 N−/− cells; P = 0.99. (D) Loss of NOMA-GAP results in PAK1/2 kinase hyperactivation during late cortical development. Phosphorylated PAK proteins were detected by Western blotting of cortical lysates derived from littermate embryos at E17.5 and E18.5. (EG) Hyperactivation of Cdc42 inhibits dendritic branching in vivo. V12 Cdc42 was expressed under the control of the NeuroD1 promoter in post-mitotic pyramidal cells by in utero electroporation of wild-type NMRI strain E15.5 embryos. Coelectroporation of a membrane-targeted GFP construct was used for visualization of dendritic processes. Analysis was carried out postnatally in cortical slices of P23 animals. Representative average Z-stack projection images of GFP fluorescence of electroporated upper-layer cortical neurons in cortical slices derived from P23 animals are shown in F. Sholl analysis was performed on these neurons. The average total number of intersections per cell are shown in E (P = 0.0048), and the Sholl profile is shown in G. Eighteen and 17 cells from three and two independent electroporations were analyzed for GFP control and NeuroD-V12 Cdc42-expressing neurons, respectively.
Figure 5.
Figure 5.
NOMA-GAP regulates dendritic branching through inhibition of Cdc42 signaling. (A) Cdc42 expression can be decreased in vivo by expression of cre recombinase under the control of the Nex promoter. Cortical lysates derived from E17 embryos were Western-blotted for Cdc42 and tubulin. (B) Quantification of the reduction in Cdc42 protein expression in the cortex of E17–E18 embryos with floxed (fl) Cdc42 gene and Nex-regulated cre recombinase expression. n = 2, 3, and 1 animals; PANOVA = 0.01. (C) Post-mitotic Nex-cre-mediated excision of one Cdc42 allele rescues dendritic MAP2 staining in N−/− animals. Thirty-micrometer vibratome brain sections of littermate P5 animals were stained for MAP2 (brown). Magnifications of the upper cortical layers are shown in the bottom panels. (DF) Dendritic complexity in N−/− mice can be rescued by post-mitotic excision of one Cdc42 allele. (D) Representative average projections of Z-stack images of Golgi-stained upper-layer pyramidal cortical neurons derived from P25–P26 animals are shown. Additional Z-stack images are available in the Supplemental Material (Supplemental Movies 3, 4). (E) Sholl profile of Golgi-stained P25–P26 N−/− Cdc42 fl/+ cre upper-layer pyramidal neurons indicates strong improvement in dendritic complexity following reduction of Cdc42 levels. n = 18 N+ cre and 26 N−/− fl/+ cre cells. Sholl profiles for N−/− and N+/+ have been described in Figure 2. The average total number of intersections per cell is shown in F. P = 0.4. (G,H) Post-mitotic excision of one Cdc42 allele improves the thickness of the cortical plate in newborn N−/− animals. (G) Nissl-stained sections of P5 littermate animals are shown. The boxed region is shown on the right. The cortical plate is marked by a bracket. Bars, 500 μm and 100 μm, respectively. (H) Relative thickness of the lateral parietal cortex of N−/− Cdc42 fl/+ cre P4–P6 animals. Measurements were made relative to littermate N+/− fl/+ animals. n = 11 N+/− fl/+, 10 N−/− fl/+, and 12 N+/− fl/+ cre animals; PANOVA = 4.9 × 10⁻⁴; PN+/− fl/+ vs. N−/− fl/+ = 5.8 × 10⁻⁵ ; PN+/− fl/+ vs. N−/− fl/+ cre = 0.27.
Figure 6.
Figure 6.
Cofilin is regulated by NOMA-GAP during cortical development. (A,B) Loss of NOMA-GAP leads to an increase in cortical cofilin phosphorylation at Ser 3. (A) Total and phospho-Ser 3 cofilin levels were detected by Western blot of E17.5 cortical lysates derived from littermate embryos. (B) Quantification of specific phospho-Ser 3 cofilin levels from Western blot analysis. Phospho-cofilin/total cofilin values were calculated relative to the average value for N+/− littermate controls. The change in specific cofilin phosphorylation was then compared across different litters. n = 14 +/− and 16 −/− animals; P = 1.4 × 10⁻⁴. (C,D) Elevation of phospho-Ser 3 cofilin levels in N−/− cortical cells. (C) Cortical cells derived from littermate E16.5 embryos were cultured for 14 d and stained in parallel for phospho-cofilin (white) and F-actin (red). (D) Quantification of the average relative levels of phospho-Ser cofilin in the soma of N+/− and N−/− DIV14 cortical cells. n = 35 +/− and 31 −/− cells. P = 6.6 × 10⁻⁹. (E,F) Phospho-Ser 3 cofilin levels are increased in the neocortex of N−/− mice. (E) Fifty-micrometer vibratome coronal brain sections of littermate E18.5 embryos were stained in parallel for phospho-Ser 3 cofilin. (F) Quantification of phospho-Ser 3 cofilin in the upper cortical layer of E18.5 animals. The relative mean staining intensity in the upper cortical layers of three pairs of littermate heterozygote and mutant embryos is shown. P = 7.7 × 10⁻⁵. (G,H) Cortical cofilin, PAK, and LIMK phosphorylation are regulated by Cdc42 downstream from NOMA-GAP. Representative Western blots of cortical lysates derived from littermate E17.5 embryos were blotted for phospho-Ser 3 cofilin (p-cofilin), phospho-PAK (p-PAK), and/or phospho-LIMK (p-LIMK1/2) and LIMK1 as indicated. Detection of phospho and total forms of cofilin and LIMK were carried out on duplicate Western blots. The tubulin loading controls shown were carried out on the membranes with anti-phospho antibodies. (I,J) Expression of cofilin promotes dendritic branching in N−/− cortical cells. (I) E16.5 primary cortical cells were transfected 1 d after plating with empty vector (control), wild-type cofilin, or S3A cofilin-expressing constructs together with a myr-GFP-expressing construct. Samples were stained at DIV5 for MAP2 (red) and GFP (green). (J) Quantification of the number of branchpoints per cell. n = 30, 32, 32, 38, 34, and 35 cells for the conditions from left to right. PANOVA = 4.2 × 10⁻⁵; PN−/− control vs. wt cofilin = 7.9 × 10⁻⁵; PN−/− control vs. SA = 7.7 × 10⁻⁶; PN+/− control vs. wild-type cofilin = 0.6.
Figure 7.
Figure 7.
Cofilin promotes dendritic branching in vivo. In vivo expression of S3A cofilin rescues dendritic complexity in N−/− upper-layer cortical neurons. E15.5 embryos were electroporated in utero with a myr-GFP-expressing construct alone or together with a construct for S3A cofilin. GFP fluorescence was analyzed postnatally in sections of P23 brains. Representative average projection images of GFP fluorescence in electroporated cortical neurons are shown in A. Z-stack movies are available in the Supplemental Material (Supplemental Movies 5–8). Sholl analysis was performed on GFP-positive neurons. The average number of total intersections per cell is shown in B. PANOVA = 1.0 × 10⁻⁵ ; P+/− GFP vs. −/− GFP = 7.0 × 10⁻⁴; P−/− GFP vs. −/− SA = 3.5 × 10⁻⁶; P+/− GFP vs. +/− SA = 0.5. Sholl profiles for N−/− and N+/− animals electroporated with S3A cofilin are shown in C and D, respectively, together with GFP control electroporated animals. (EH) The complexity of basal and apical dendrites was independently analyzed. The average total number of basal or apical intersections per cell is shown in E and F, respectively. (E) PANOVA=5.4 × 10⁻⁵; P+/− GFP vs. −/− GFP = 0.0009; P+/− GFP vs. −/− SA = 0.59; P−/− GFP vs. −/− SA = 4.7 × 10⁻⁷; P+/− GFP vs. +/− SA = 0.29. (F) PANOVA=9.0 × 10⁻³; P+/− GFP vs. −/− GFP = 0.06; P+/−GFP vs. −/− SA = 0.93; P−/− GFP vs. −/− SA = 0.02; P+/− GFP vs. +/− SA = 0.18. The Sholl profiles for basal and apical dendrites are shown in G and H, respectively. Four N−/− GFP, three N+/− GFP, three N−/− S3A cofilin, and two N+/− S3A cofilin animals were used for analysis. Ten cells were analyzed per animal.

Comment in

References

    1. Aizawa H, Wakatsuki S, Ishii A, Moriyama K, Sasaki Y, Ohashi K, Sekine-Aizawa Y, Sehara-Fujisawa A, Mizuno K, Goshima Y, et al. 2001. Phosphorylation of cofilin by LIM-kinase is necessary for semaphorin 3A-induced growth cone collapse. Nat Neurosci 4: 367–373 - PubMed
    1. Arber S, Barbayannis FA, Hanser H, Schneider C, Stanyon CA, Bernard O, Caroni P 1998. Regulation of actin dynamics through phosphorylation of cofilin by LIM-kinase. Nature 393: 805–809 - PubMed
    1. Armstrong DD, Dunn K, Antalffy B 1998. Decreased dendritic branching in frontal, motor and limbic cortex in Rett syndrome compared with trisomy 21. J Neuropathol Exp Neurol 57: 1013–1017 - PubMed
    1. Bauman ML, Kemper TL, Arin DM 1995. Pervasive neuroanatomic abnormalities of the brain in three cases of Rett's syndrome. Neurology 45: 1581–1586 - PubMed
    1. Bellenchi GC, Gurniak CB, Perlas E, Middei S, Ammassari-Teule M, Witke W 2007. N-cofilin is associated with neuronal migration disorders and cell cycle control in the cerebral cortex. Genes Dev 21: 2347–2357 - PMC - PubMed

Publication types

Substances