

Comprehensive molecular characterization of human colon and rectal cancer
- PMID: 22810696
- PMCID: PMC3401966
- DOI: 10.1038/nature11252
Comprehensive molecular characterization of human colon and rectal cancer
Abstract
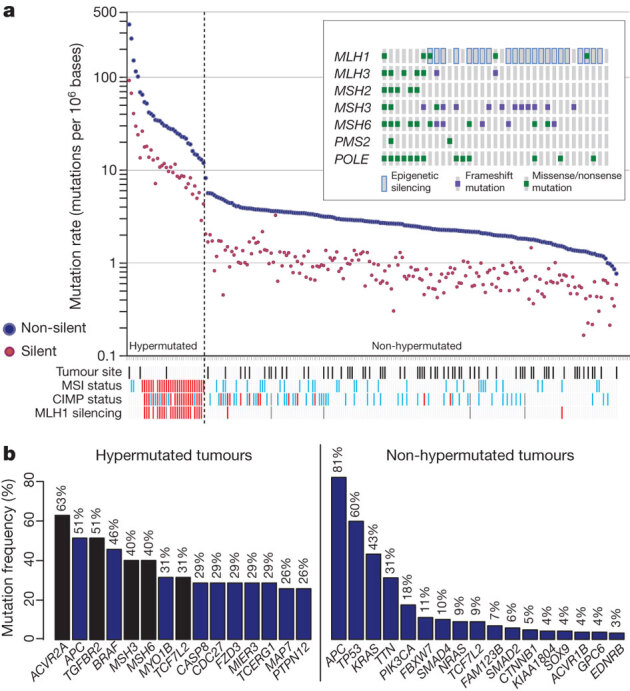
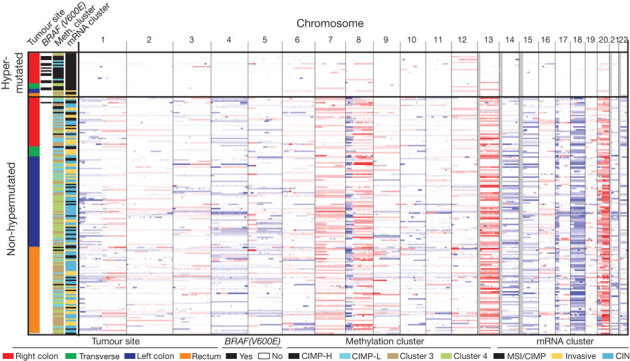
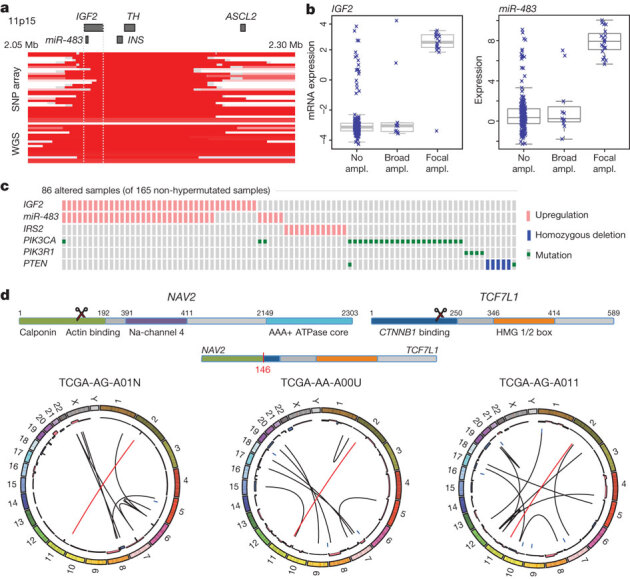
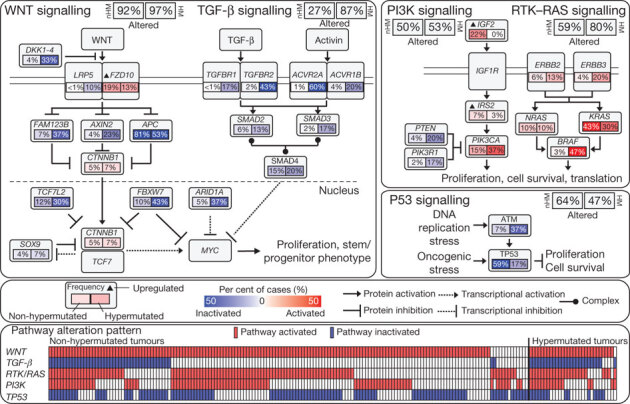
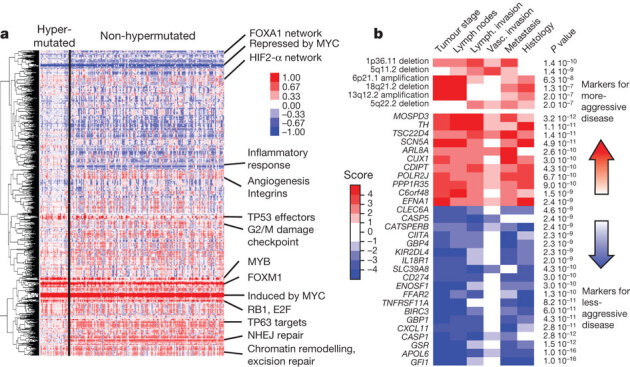
To characterize somatic alterations in colorectal carcinoma, we conducted a genome-scale analysis of 276 samples, analysing exome sequence, DNA copy number, promoter methylation and messenger RNA and microRNA expression. A subset of these samples (97) underwent low-depth-of-coverage whole-genome sequencing. In total, 16% of colorectal carcinomas were found to be hypermutated: three-quarters of these had the expected high microsatellite instability, usually with hypermethylation and MLH1 silencing, and one-quarter had somatic mismatch-repair gene and polymerase ε (POLE) mutations. Excluding the hypermutated cancers, colon and rectum cancers were found to have considerably similar patterns of genomic alteration. Twenty-four genes were significantly mutated, and in addition to the expected APC, TP53, SMAD4, PIK3CA and KRAS mutations, we found frequent mutations in ARID1A, SOX9 and FAM123B. Recurrent copy-number alterations include potentially drug-targetable amplifications of ERBB2 and newly discovered amplification of IGF2. Recurrent chromosomal translocations include the fusion of NAV2 and WNT pathway member TCF7L1. Integrative analyses suggest new markers for aggressive colorectal carcinoma and an important role for MYC-directed transcriptional activation and repression.
Conflict of interest statement
The author declare no competing financial interests.
Figures
Comment in
-
Landscape of genetic aberrations detected in human colorectal cancers.Gastroenterology. 2013 Sep;145(3):686-8. doi: 10.1053/j.gastro.2013.07.029. Epub 2013 Jul 25. Gastroenterology. 2013. PMID: 23891613 No abstract available.
References
Publication types
MeSH terms
Grants and funding
- U24CA143840/CA/NCI NIH HHS/United States
- P30 CA016672/CA/NCI NIH HHS/United States
- U24 CA143882/CA/NCI NIH HHS/United States
- U24 CA143866/CA/NCI NIH HHS/United States
- U54 HG003273/HG/NHGRI NIH HHS/United States
- U24 CA143843/CA/NCI NIH HHS/United States
- U24CA143867/CA/NCI NIH HHS/United States
- U24CA143848/CA/NCI NIH HHS/United States
- U54 HG003079/HG/NHGRI NIH HHS/United States
- U24CA143799/CA/NCI NIH HHS/United States
- U24 CA143883/CA/NCI NIH HHS/United States
- U24 CA143867/CA/NCI NIH HHS/United States
- U54 HG003067/HG/NHGRI NIH HHS/United States
- U54HG003273/HG/NHGRI NIH HHS/United States
- U24 CA143835/CA/NCI NIH HHS/United States
- U24CA143858/CA/NCI NIH HHS/United States
- U24CA143882/CA/NCI NIH HHS/United States
- U24CA144025/CA/NCI NIH HHS/United States
- P30 CA016086/CA/NCI NIH HHS/United States
- U54HG003067/HG/NHGRI NIH HHS/United States
- U24 CA143845/CA/NCI NIH HHS/United States
- U24 CA143799/CA/NCI NIH HHS/United States
- U24 CA144025/CA/NCI NIH HHS/United States
- U24CA143883/CA/NCI NIH HHS/United States
- U54HG003079/HG/NHGRI NIH HHS/United States
- U24 CA126554/CA/NCI NIH HHS/United States
- U24 CA143840/CA/NCI NIH HHS/United States
- U24CA143835/CA/NCI NIH HHS/United States
- U24 CA143858/CA/NCI NIH HHS/United States
- U24CA143843/CA/NCI NIH HHS/United States
- R01 HG006272/HG/NHGRI NIH HHS/United States
- U24 CA143848/CA/NCI NIH HHS/United States
- U24CA143866/CA/NCI NIH HHS/United States
- U24CA143845/CA/NCI NIH HHS/United States
LinkOut - more resources
Full Text Sources
Other Literature Sources
Medical
Molecular Biology Databases
Research Materials
Miscellaneous
