. 2012 Oct;86(19):10462-73.
doi: 10.1128/JVI.00935-12. Epub 2012 Jul 18.

Cytoplasmic trafficking, endosomal escape, and perinuclear accumulation of adeno-associated virus type 2 particles are facilitated by microtubule network

Affiliations

Cytoplasmic trafficking, endosomal escape, and perinuclear accumulation of adeno-associated virus type 2 particles are facilitated by microtubule network

Ping-Jie Xiao et al. J Virol. 2012 Oct.

Abstract

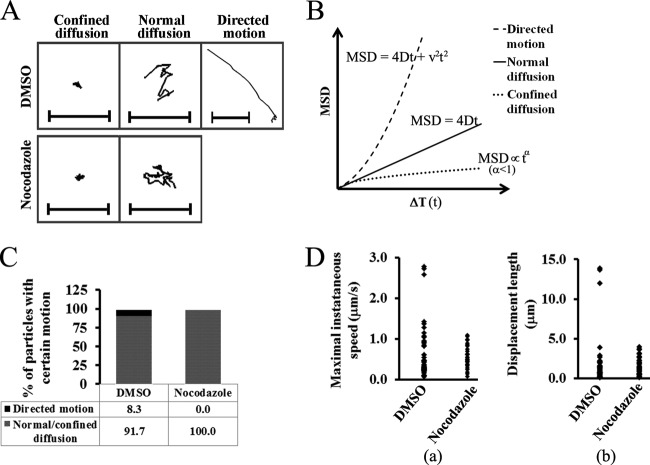
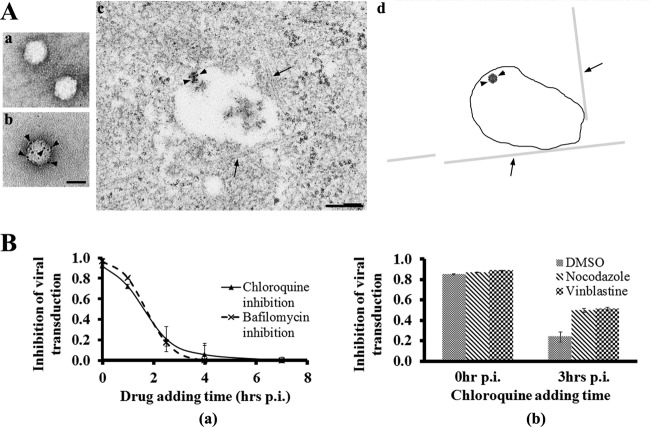
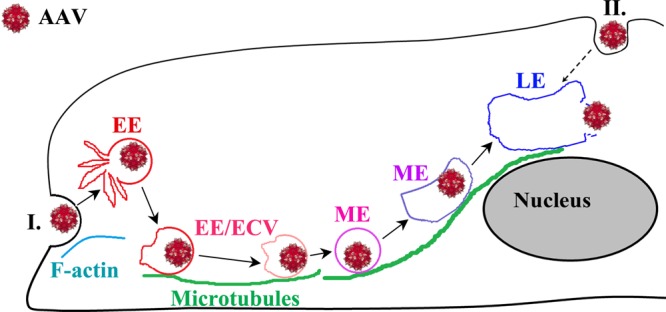
Understanding adeno-associated virus (AAV) trafficking is critical to advance our knowledge of AAV biology and exploit novel aspects of vector development. Similar to the case for most DNA viruses, after receptor binding and entry, AAV traverses the cytoplasm and deposits the viral genome in the cell nucleus. In this study, we examined the role of the microtubule (MT) network in productive AAV infection. Using pharmacological reagents (e.g., nocodazole), live-cell imaging, and flow cytometry analysis, we demonstrated that AAV type 2 (AAV2) transduction was reduced by at least 2-fold in the absence of the MT network. Cell surface attachment and viral internalization were not dependent on an intact MT network. In treated cells at 2 h postinfection, quantitative three-dimensional (3D) microscopy determined a reproducible difference in number of intracellular particles associated with the nuclear membrane or the nucleus compared to that for controls (6 to 7% versus 26 to 30%, respectively). Confocal microscopy analysis demonstrated a direct association of virions with MTs, further supporting a critical role in AAV infection. To investigate the underling mechanisms, we employed single-particle tracking (SPT) to monitor the viral movement in real time. Surprisingly, unlike other DNA viruses (e.g., adenovirus [Ad] and herpes simplex virus [HSV]) that display bidirectional motion on MTs, AAV2 displays only unidirectional movement on MTs toward the nuclei, with peak instantaneous velocities at 1.5 to 3.5 μm/s. This rapid and unidirectional motion on MTs lasts for about 5 to 10 s and results in AAV particles migrating more than 10 μm in the cytoplasm reaching the nucleus very efficiently. Furthermore, electron microscopy analysis determined that, unlike Ad and HSV, AAV2 particles were transported on MTs within membranous compartments, and surprisingly, the acidification of AAV2-containing endosomes was delayed by the disruption of MTs. These findings together suggest an as-yet-undescribed model in which after internalization, AAV2 exploits MTs for rapid cytoplasmic trafficking in endosomal compartments unidirectionally toward the perinuclear region, where most acidification events for viral escape take place.


Figures

Fig 1
Fig 1
Microtubule disruption before viral inoculation reduces early AAV2 transduction. At 30 to 60 min after pretreatment with DMSO or nocodazole, HeLa cells were incubated with AAV2-CMV-GFPsc (scAAV2-GFP) particles at 4°C for 40 min, and unbound virions were washed out before transferring HeLa cells to 37°C (“pulse infection”). A video of the GFP expression was taken from 3 h to 21 h after pulse infection. (A) Snapshots of the video were taken at 3, 6, 8, 12, 16, and 21 h p.i. (B) Quantification of GFP fluorescence intensity in the snapshots with Image J. (C) HeLa cells were treated with DMSO or nocodazole at 30 to 60 min before pulse infection with scAAV2-GFP at different dosages (80, 400, 2,000, and 10,000 vgs/cell). GFP expression was measured by flow cytometry at 11 h p.i., and mean fluorescence intensity (MFI) was normalized to that of DMSO treatment. The normalized ratio of the percentage of GFP-positive cells is shown in Fig. S1 in the supplemental material.
Fig 2
Fig 2
MT disruption does not impair the attachment and internalization of AAV2. HeLa cells were preincubated with DMSO or nocodazole for 30 to 60 min before pulse infection with Cy5-AAV2. (A) To determine the binding efficiency, cells were harvested at 0 h p.i. for viral genome extraction. The number of viral genomes per cell (vgs/cell) was determined by quantitative PCR. (B and C) Cells were fixed at 0 h or 1 h p.i. without permeabilization. Nuclei were stained with DAPI (blue), and AAV2 capsids were stained with monoclonal antibody A20 (green). Before membrane permeabilization, A20 antibody is not able to access the viral particles inside the cells and thus binds only to the uninternalized AAV2 virions (yellow in the merged figures). (B) Representative images from maximum-intensity projection (MIP) show the costaining between A20 and Cy5 signals. Several representative uninternalized AAV2 particles are highlighted by arrowheads. (C) Quantification of colocalization between Cy5 and A20 as a measurement of viral particles remaining on cell surface and those which have internalized.
Fig 3
Fig 3
Early perinuclear accumulation and nuclear entry are reduced by the disruption of the MT network. HeLa cells were preincubated with DMSO or nocodazole at 30 to 60 min before the pulse infection with Cy5-AAV2. Cells were fixed at 0 h or 2 h p.i. Nuclei were stained with DAPI (blue), and MTs were stained with alpha-tubulin antibody (green). (A) Representative 2D images show the distribution of Cy5-AAV2 particles (red) at 2 h p.i. in the cells treated with DMSO or nocodazole. (B) Representative images illustrate the quantification of viral distribution using 3D microscopy in the cells treated with DMSO (panels a to c) or nocodazole (panels d to f) as described previously (55). Panels a and d, top views; panels b to f, magnified side views of the insets in panels a and d; panels b and e, side views observed above the nucleus (the nuclear envelope is indicated by the blue layer, based on the DAPI signal); panels c and f, side views observed inside the nucleus (between the top and bottom nuclear envelopes). AAV2 particles in cytoplasm are highlighted as red, these associated with the nuclear envelope are cyan, and these inside the nucleus are yellow. More details about the viral distribution in these cells are shown in Movies S3 and S4 in the supplemental material. (C) Percentages of AAV2 particles in the nuclei (panel a) and associated with the nuclear envelope (panel b), calculated from 15 to 20 cells in each group based on the quantification illustrated in panel B).
Fig 4
Fig 4
AAV2 colocalizes with MTs. Cells were fixed at 30 min (a to d) or 2 h (e) after pulse infection with Cy5-AAV2. The nucleus was stained with DAPI (blue), and MTs were stained with alpha-tubulin antibody (green). The localization of Cy5-AAV2 (red) on MTs (green) is shown in panels a and e. Panels b to d show magnified views of the inset in panel a.
Fig 5
Fig 5
Fast and unidirectional movement of AAV2 toward the perinuclear region. Videos were taken at 1 h after pulse infection with Cy5-AAV2 using an Olympus IX81 inverted fluorescence microscope. (A) Snapshots of consecutive frames with a 2.2-s time interval show the fast and directed movement of Cy5-AAV2 (purple and indicated by arrowheads) on microtubules (green) toward the perinuclear region. (B) Trajectory of the Cy5-AAV2 particle indicated by arrowheads in panel A. Frames subject to directional transport are shown as green points and lines, and those with confined motion in the perinuclear region are indicated as black points. The bar represents 5 μm. (C) Instantaneous velocity of the particle (indicated by arrowheads in panel A) over time. (D) The displacement from the starting position (panel a) and mean square displacement (MSD) (panel b) are plotted for the particle indicated by arrowheads in panel A. In panel b, the plot between MSD and time interval (ΔT) is fitted by a quadratic curve (dashed line, MSD = 0.7269t2 + 1.902t) with r2 = 0.9997.
Fig 6
Fig 6
Fast and unidirectional movement of AAV2 particles is dependent on intact microtubules. (A) Representative trajectories for AAV2 in DMSO- or nocodazole-treated cells as shown in Movies S6 and S7 in the supplemental material. Bars represent 5 μm. (B) Three simulated MSD plots for various types of particle motion. The mean square displacement (MSD) is plotted against time interval ΔT (t). Normal diffusion is usually described by a linear plot given by the formula MSD = 4Dt (D is the diffusion coefficient). Directed motion is usually described by a quadratic curve given by the formula MSD = 4Dt + v2t2 (v is the mean velocity of the motion). An asymptotic behavior with MSD∝tα (α<1) indicates confined diffusion. (C) Proportions of viral particles with directed motion or diffusion from MSD analysis. (D) Maximal instantaneous speed (panel a) and displacement length (panel b) of each AAV2 track. For panels C and D, trajectories were generated only for these viral particles continuously tracked over 20 frames, and about 40 to 60 trajectories were analyzed for each group.
Fig 7
Fig 7
Association of AAV2-containing endosomes with MTs and delayed endosomal acidification upon MT disruption. (A) AAV2 particles migrate on MTs in membranous structures. AAV2 particles before (panel a) and after (panel b) labeling of nanogold were demonstrated by TEM. Bar, 20 nm. A micrograph showing the direct association of AAV-containing endosome with MTs at 1 h after pulse infection of nanogold-labeled AAV2 (panel c) is simplified in a cartoon diagram (panel d). In the cartoon, MTs are indicated by arrows, the endosome membrane is indicated by closed line, and virus is indicated by arrowheads. Bar, 200 nm. (B) Acidification of virus-containing endosomes is inhibited by lysosomotropic chemicals at various time points after pulse infection of AAV2 (panel a). At 1 h after pretreatment with anti-MT drugs (nocodazole and vinblastine), chloroquine was added at 0 h or 3 h after pulse infection of AAV2. To calculate the inhibition of viral transduction, the expression level of GFP transgene was measured with a flow cytometer and normalized to corresponding treatments without chloroquine (panel b).
Fig 8
Fig 8
A model for the role of microtubules in the cytoplasmic trafficking and endosomal acidification for AAV2 escape. After binding and endocytosis on the cell surface, AAV2 virions may take two possible trafficking routes toward the nucleus. Route I, for these internalized at sites distal from the nucleus, virions migrate on MT tracks in endosomes to traverse the dense cytoplasm toward the perinuclear regions of host cells. Route II, for these internalized at sites close to the nucleus, virions in endocytic vesicles can reach the nucleus by slower MT-independent migration through the cytoplasm between the cytoplasmic membrane and nuclear envelope. For both routes, acidification of the AAV2-containing endosomal compartment happens at the perinuclear region and allows the escape of viral particles from vesicles, a prerequisite step for nuclear entry.

References

    1. Akita H, et al. 2010. Particle tracking of intracellular trafficking of octaarginine-modified liposomes: a comparative study with adenovirus. Mol. Ther. 18:955–964 - PMC - PubMed
    1. Bartlett JS, Wilcher R, Samulski RJ. 2000. Infectious entry pathway of adeno-associated virus and adeno-associated virus vectors. J. Virol. 74:2777–2785 - PMC - PubMed
    1. Bremner KH, et al. 2009. Adenovirus transport via direct interaction of cytoplasmic dynein with the viral capsid hexon subunit. Cell Host Microbe 6:523–535 - PMC - PubMed
    1. Cassimeris LU, Wadsworth P, Salmon ED. 1986. Dynamics of microtubule depolymerization in monocytes. J. Cell Biol. 102:2023–2032 - PMC - PubMed
    1. Choi VW, Samulski RJ, McCarty DM. 2005. Effects of adeno-associated virus DNA hairpin structure on recombination. J. Virol. 79:6801–6807 - PMC - PubMed

Publication types

LinkOut - more resources