. 2012 Oct;86(19):10524-32.
doi: 10.1128/JVI.01077-12. Epub 2012 Jul 18.

Three murine leukemia virus integration regions within 100 kilobases upstream of c-myb are proximal to the 5' regulatory region of the gene through DNA looping

Affiliations

Three murine leukemia virus integration regions within 100 kilobases upstream of c-myb are proximal to the 5' regulatory region of the gene through DNA looping

Junfang Zhang et al. J Virol. 2012 Oct.

Abstract

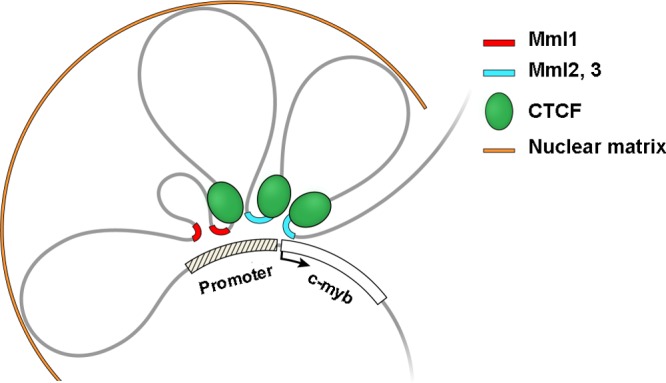
Retroviruses integrated into genomic DNA participate in long-range gene activation from as far away as several hundred kilobases. Hypotheses have been put forth to account for these phenomena, but data have not been provided to support a physical mechanism that explains long-range activation. In murine leukemia virus-induced myeloid leukemia in mice, integrated proviruses have been found upstream of c-myb in three regions, named Mml1, Mml2, and Mml3 (25, 50, and 70 kb upstream, respectively). The transcription factor c-Myb is an oncogene whose dysregulation and/or mutation can lead to human leukemia. We hypothesized that the murine c-myb upstream region contains regulatory elements accessed by the retrovirus. To identify regulatory sites in the murine c-myb upstream region, we looked by chromatin immunoprecipitation with microarray technology (ChIP-on-chip) for histone modifications implicating gene activation in normal cells. H3K4me3, H3K4me1, and H3K9/14ac were enriched at Mml1 and/or Mml2 in the myeloblastic cell line M1, which expresses c-myb. The enrichment of all of these histone marks decreased with differentiation-induced downregulation of the gene in M1 cells but increased and spread in tumor cells containing integrated provirus. Importantly, using chromosome conformation capture (3C)-quantitative PCR assays, interactions between the 5' region, including the promoter and all Mml sites (Mml1, Mml2, and Mml3), were detected due to DNA looping in M1 cells and tumor cells with provirus in Mml1, Mml2, or Mml3. Therefore, our study provides a new mechanism of retrovirus insertional mutagenesis whereby spatial chromatin organization allows distally located provirus, with its own enhancer elements, to access the 5' regulatory region of the gene.


Figures

Fig 1
Fig 1
Expression of c-myb RNA in tumor cell lines with integrated provirus. Expression levels were determined by quantitative reverse transcription PCR. (A) Total RNA samples were prepared from M1 cells, M1 cells treated with IL-6 for 1 or 5 days, 6 tumor cell lines with virus integrated in the Mml1, Mml2, or Mml3 region, and NIH 3T3 cells. Data are normalized to GAPDH expression. Error bars represent standard deviations (SD) (n = 3). An asterisk represents significant difference of expression compared to M1 cells (P < 0.05). **, P < 0.01. (B) Response of tumor cell lines to IL-6. Total RNA was prepared from the indicated tumor cell lines and M1 cells after treatment with IL-6 for 0, 3, 6, and 24 h. Data are normalized to initial c-myb expression in individual cell lines. Error bars represent SD (n = 3).
Fig 2
Fig 2
Histone modifications present at the c-myb gene and Mml regions correlate with c-myb expression. (A) ChIP-on-chip data of histone modifications known to represent active transcription, H3K9/14ac and H3K4me3, in M1 cells. The schematic presentation shows an ∼600-kb region surrounding the c-myb proto-oncogene on mouse chr.10. Four known genes on the locus are shown on top by solid rectangles with arrows that indicate their transcriptional orientation. Locations of viral integrations sites Mml1, Mml2, and Mml3 are shown. The area within the box, the c-myb gene through Mml1, is expanded in panel B. (B) Detailed analysis of the H3K4me3 distribution at the c-myb gene and the Mml1 region in cell line M1, M1 treated with IL-6 for 5 days, and cell lines with proviral integrations at Mml1 (30C-18 and 30-3-14) and Mml3 (30-2-7). The location of Mml1 is indicated by a red vertical arrow. (C) ChIP-on-chip data of H3K4me1 in M1 cells and detailed analysis of the H3K4me1 distribution in the c-myb 5′ end and Mml regions of the indicated cell lines. Tumor cell lines with integrations in Mml1 are 30C-18, 30A2-2-6, and 30-3-14. A tumor cell line with a provirus in Mml3 is 30-2-7. The locations of Mml1, Mml2, and Mml3 are indicated by red vertical arrows. Boxes in B and C depict the presence of major differences in enrichment between cells lines. Normalized enrichment data (IP/input ratio) are plotted on a log 2 scale.
Fig 3
Fig 3
Luciferase assays of potential enhancers in the Mml1 region. Three fragments (E1, E2, and E3) marked by H3K4me3 in the Mml1 region (A) were cloned separately upstream of the c-myb promoter controlling a luciferase reporter gene (B) and transfected into NIH 3T3 and 293T cell lines. The green horizontal arrow shows the transcription orientation of the gene. One of the regions (E1) increases the luciferase transcription by 2- to 4-fold compared to the promoter-only control (C). Data are normalized to cotransfected Renilla gene expression. Error bars represent SD (n = 3).
Fig 4
Fig 4
Long-range interactions detected between the Mml regions and the 5′ c-myb region, including the promoter. Interactions between the 5′ c-myb region and regions up to −100 kb upstream were determined by 3C-qPCR. A HindIII fragment, including the c-myb promoter, was used as the bait. (A) The 3C-qPCR assay was performed on differentiated (M1 plus IL-6) and undifferentiated M1 cells, and the data show the cross-linking frequency between the upstream regions and the bait fragment. The locations of HindIII fragments are indicated below the graph. Mml1, Mml2, and Mml3 regions are marked by red arrows. Data are normalized to the ERCC3 internal cross-linking control (means and standard errors of the means [SEM]; n = 3). (B) Sequences of retrovirus integration sites in tumor cell lines. Virus-chromosomal DNA junction sequences were determined by a shotgun cloning method as described previously (34). Genomic DNA was digested with MseI and ligated with an adaptor (the sequence is available upon request). PCR was carried out using a viral LTR primer and an adaptor primer to amplify the junction sequences, followed by TA cloning and sequencing. Virus integration site sequences in tumor cell lines are shown as indicated. Red vertical arrows mark the virus integration sites. Black horizontal arrows indicate the orientation of retrovirus sequences inserted into the genome. A green solid rectangle with an arrow depicts the c-myb gene and its transcriptional orientation. (C) Long-range interactions detected between the 5′ c-myb region and Mml regions in tumor cells. 3C-qPCR assays were performed at the same time in M1 cells and tumor cell lines containing a provirus in one of the Mml regions. The upstream HindIII fragments examined in these experiments are indicated. Integration sites in tumor cell lines are marked by red arrows. The locations of integrated proviruses in cell lines 30C-18 (Mml1), 30-2-9 (Mml2), and 30-2-7 (Mml3) are depicted, and the genomic sequences at the virus-cell junctions are presented in panel B. The Mml3 location was previously determined by Southern blot analysis. Data are normalized to the ERCC3 internal cross-linking frequency control (means and SEM; n = 3). (D) 3C-qPCR assay of NIH 3T3 cells. Data are normalized to the ERCC3 control (means and SEM; n = 3).
Fig 5
Fig 5
CTCF is recruited to the promoter interaction regions. (A) ChIP-on-chip experiment using antibody specific for CTCF and the microarray described in the legend to Fig. 2 were performed on the indicated cell lines. Red vertical arrows indicate Mml1, Mml2, and Mml3. (B) Detailed locations of CTCF binding sites and the chromosome structure of the c-myb locus in M1 cells. 3C-qPCR data of the c-myb locus in M1 cells (details are given in the legend to Fig. 4). Potential matrix attachment regions (MARs) were predicted within a 100-kb region upstream of c-myb by the online program MARWIZ (http://genomecluster.secs.oakland.edu/marwiz). In silico data show that potential MARs are located at the boundaries of the loops identified in the 3C assay (alignments are shown by dotted lines).
Fig 6
Fig 6
Model of the long-range interactions between retrovirus integration regions and the 5′ end of c-myb in tumor cells. Proviruses in Mml1 (red lines) or Mml2 and Mml3 (blue lines) come in close proximity to the 5′-end regulatory region of the gene by DNA looping. CTCF binding near the interaction regions is suggested to be involved in the looping formation. Potential MARs were found at the boundaries of the looping structure.

References

    1. Barski A, et al. 2007. High-resolution profiling of histone methylations in the human genome. Cell 129:823–837 - PubMed
    1. Bender TP, Thompson CB, Kuehl WM. 1987. Differential expression of c-myb mRNA in murine B lymphomas by a block to transcription elongation. Science 237:1473–1476 - PubMed
    1. Clappier E, et al. 2007. The C-MYB locus is involved in chromosomal translocation and genomic duplications in human T-cell acute leukemia (T-ALL), the translocation defining a new T-ALL subtype in very young children. Blood 110:1251–1261 - PubMed
    1. Daniel R, Smith JA. 2008. Integration site selection by retroviral vectors: molecular mechanism and clinical consequences. Hum. Gene Ther. 19:557–568 - PMC - PubMed
    1. Dekker J, Rippe K, Dekker M, Kleckner N. 2002. Capturing chromosome conformation. Science 295:1306–1311 - PubMed

Publication types

Associated data