

Feasibility analysis of high resolution tissue image registration using 3-D synthetic data
- PMID: 22811962
- PMCID: PMC3312712
- DOI: 10.4103/2153-3539.92037
Feasibility analysis of high resolution tissue image registration using 3-D synthetic data
Abstract
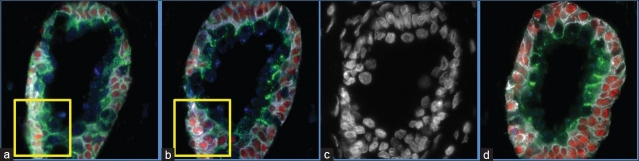
Background: Registration of high-resolution tissue images is a critical step in the 3D analysis of protein expression. Because the distance between images (~4-5μm thickness of a tissue section) is nearly the size of the objects of interest (~10-20μm cancer cell nucleus), a given object is often not present in both of two adjacent images. Without consistent correspondence of objects between images, registration becomes a difficult task. This work assesses the feasibility of current registration techniques for such images.
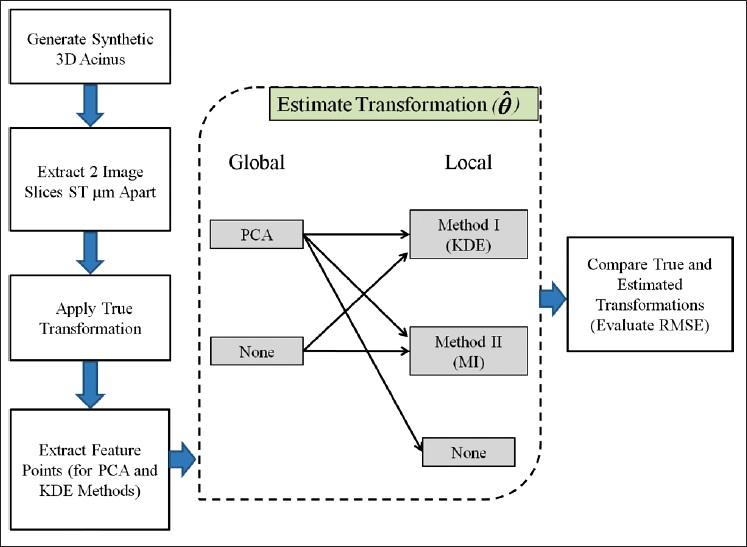
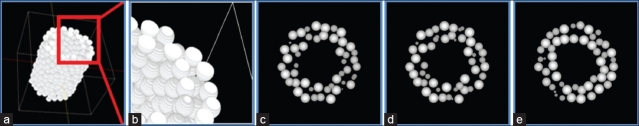
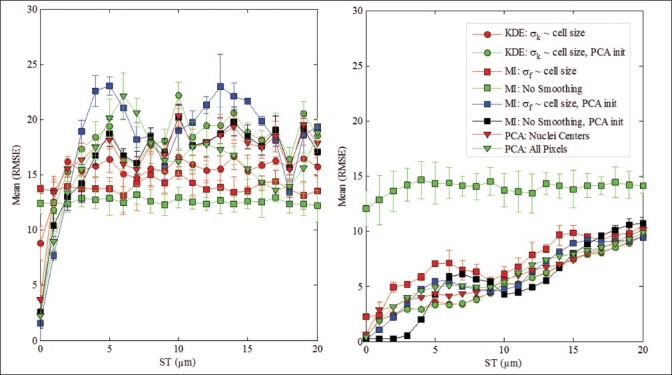
Methods: We generated high resolution synthetic 3-D image data sets emulating the constraints in real data. We applied multiple registration methods to the synthetic image data sets and assessed the registration performance of three techniques (i.e., mutual information (MI), kernel density estimate (KDE) method [1], and principal component analysis (PCA)) at various slice thicknesses (with increments of 1μm) in order to quantify the limitations of each method.
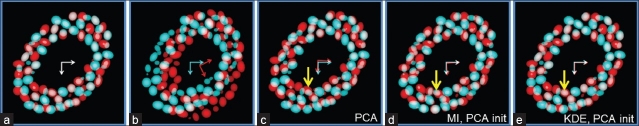
Results: Our analysis shows that PCA, when combined with the KDE method based on nuclei centers, aligns images corresponding to 5μm thick sections with acceptable accuracy. We also note that registration error increases rapidly with increasing distance between images, and that the choice of feature points which are conserved between slices improves performance.
Conclusions: We used simulation to help select appropriate features and methods for image registration by estimating best-case-scenario errors for given data constraints in histological images. The results of this study suggest that much of the difficulty of stained tissue registration can be reduced to the problem of accurately identifying feature points, such as the center of nuclei.
Keywords: 3-D Tissue Image Registration; Cancer Heterogeneity Analysis; Kernel Density; Tissue Image Processing.
Figures
References
-
- Tsin Y, Kanade T. A correlation-based approach to robust point set registration. European Conference on Computer Vision (ECCV) 2004;3:558–69.
-
- Heppner GH. Tumor heterogeneity. Cancer Res. 1984;44:2259. - PubMed
-
- Vamvakidou AP, Mondrinos MJ, Petushi SP, Garcia FU, Lelkes PI, Tozeren A. Heterogeneous breast tumoroids: An in vitro assay for investigating cellular heterogeneity and drug delivery. J Biomol Screen. 2007;12:13–20. - PubMed
-
- Litterman AJ, Shapiro R, Berman R, Pavlick A, Daarvishian F, Blank S, et al. Detection of BRAF kinase mutations in melanoma, ovarian, and prostate carcinomas: Evidence for tumor heterogeneity in clinical samples. J Clin Oncol. 2009;27:15.
