. 2012 Oct 15;63(1):501-6.
doi: 10.1016/j.neuroimage.2012.07.008. Epub 2012 Jul 14.

Loss of reliable temporal structure in event-related averaging of naturalistic stimuli

Affiliations

Loss of reliable temporal structure in event-related averaging of naturalistic stimuli

Aya Ben-Yakov et al. Neuroimage. .

Abstract

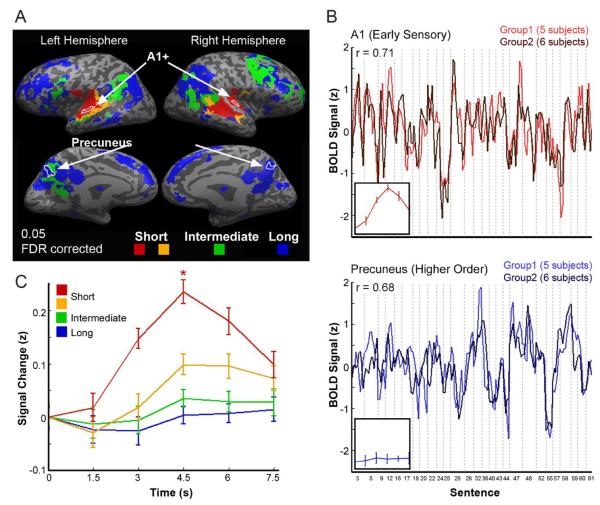
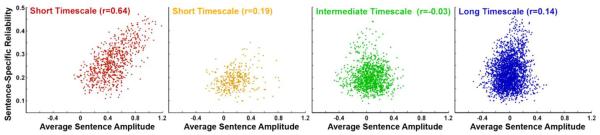
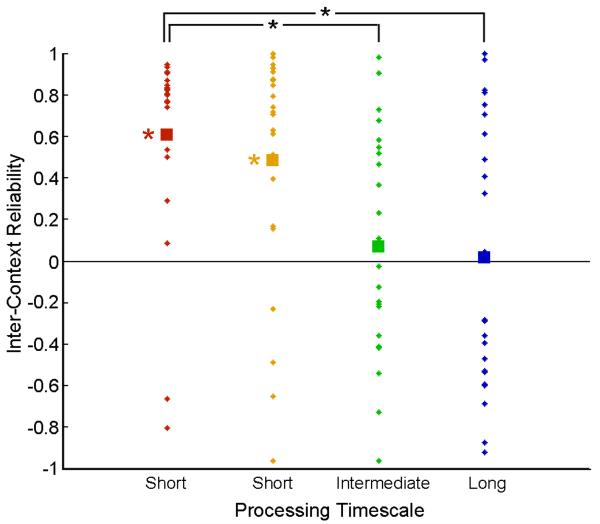
To separate neural signals from noise, brain responses measured in neuroimaging are routinely averaged across space and time. However, such procedures may obscure some properties of neural activity. Recently, multi-voxel pattern analysis methods have demonstrated that patterns of activity across voxels contain valuable information that is concealed by spatial averaging. Here we show that temporal patterns of neural activity contain information that can discriminate different stimuli, even within brain regions that show no net activation to that stimulus class. Furthermore, we find that in many brain regions, responses to natural stimuli are highly context dependent. In such cases, prototypical event-related responses do not even exist for individual stimuli, so that averaging responses to the same stimulus within different contexts may worsen the effective signal-to-noise. As a result, analysis of the temporal structures of single events can reveal aspects of neural dynamics which cannot be detected using standard event-related averaging methods.


Figures

Figure 1
Figure 1
Event-related averaging can obscure reliable responses to individual stimuli A) Cortical areas that responded reliably (across subjects) to a recording of a story, presented on an inflated brain. The colors represent different processing timescales, as determined using a separate study in which the temporal structure of the intact story was disrupted at different scales (adapted from(Lerner et al., 2011)). Short timescale (red and yellow), intermediate timescales (green), long timescale (blue). Borders of two ROIs (A1+ and precuneus) are marked in white. B) Concatenation of the mean z-scored time courses of 27 individual sentences, each longer than 6s. The vertical dotted lines mark the boundaries of individual (non-continuous) sentences within the story. Results from A1 (top panel) are presented in red and results from the precuneus (bottom panel) are presented in blue. Each time course represents the average response time course across independent group of subjects (group 1 n=5, group 2 n=6) who listened to the story. The small insets depict the average event-related response to these sentences (after z-scoring the signal within individuals) within each region. The response is plotted relative to the first time point (sentence onset) which was subtracted from each all other time points in a sentence. C) Event-related average response across all sentences in each of the processing timescales. For each timescale we averaged the time courses across all voxels and then performed the event-related averaging. In regions with short processing timescales (red), the response was significantly greater than zero. Note that the temporal patterns of neural activity to different stimulus exemplars may contain information, even within brain regions that show no net activation to that class of stimuli.
Figure 2
Figure 2
Effect of event-related averaging on signal reliability Reliability of concatenated single sentence time-courses is plotted against the amplitude of the mean response to a sentence in voxels of different processing timescales. Each dot represents the value within a single voxel, with different panels for each processing timescale. In early auditory areas, the mean response amplitude is strongly correlated with the reliability of responses to individual sentences, while higher order cortical regions exhibit a much weaker correlation. Although the correlation reached significance at all processing timescales aside from the intermediate timescale (red voxels, t(722) = 22.23, p<0.001; yellow voxels, t(337) = 15.19, p<0.001; green voxels, t(1174) = 6.8, p=0.2 NS; blue voxels, t(2577) = 10.08, p<0.001), in a direct comparison the correlation in the shortest processing timescale regions (red) proved significantly stronger than all other regions (red-yellow, 8.43, p<0.05; red-green, 16.72, p<0.05; red-blue, 14.46, p<0.05, corrected).
Figure 3
Figure 3
Reliability of sentence-evoked responses across sentences The inter-context reliability of the sentence-evoked response (average response across participants) is plotted for each of the processing timescales. The dots represent the reliability of each sentence (23 sentences) and the squares indicate the mean sentence reliability of each processing timescale. The short processing timescale regions (red, yellow), exhibited a significantly positive average correlation (red: t(22)=6, yellow: t(22)=3.55;p<0.05, corrected). A direct comparison between groups revealed a significant difference only between the short time-scale (red bar) and long time-scales (green and blue bars)

References

    1. Bartels A, Zeki S. Functional brain mapping during free viewing of natural scenes. Hum Brain Mapp. 2004;21:75–85. - PMC - PubMed
    1. Ben-Yakov A, Dudai Y. Constructing realistic engrams: poststimulus activity of hippocampus and dorsal striatum predicts subsequent episodic memory. J Neurosci. 2011;31:9032–9042. - PMC - PubMed
    1. Benjamini Y, Hochberg Y. Controlling the False Discovery Rate - a Practical and Powerful Approach to Multiple Testing. Journal of the Royal Statistical Society Series B-Methodological. 1995;57:289–300.
    1. Bentin S, Allison T, Puce A, Perez E, McCarthy G. Electrophysiological Studies of Face Perception in Humans. J Cogn Neurosci. 1996;8:551–565. - PMC - PubMed
    1. Boynton G, Engel S, Glover G, Heeger D. Linear systems analysis of functional magnetic resonance imaging in human V1. J Neurosci. 1996;16:4207–4221. - PMC - PubMed

Publication types