

Intelligent data analysis to model and understand live cell time-lapse sequences
- PMID: 22814575
- PMCID: PMC6485599
- DOI: 10.3414/ME11-02-0041
Intelligent data analysis to model and understand live cell time-lapse sequences
Abstract
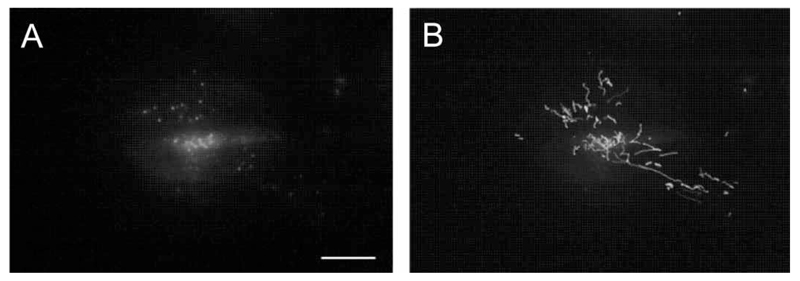
Background: One important aspect of cellular function, which is at the basis of tissue homeostasis, is the delivery of proteins to their correct destinations. Significant advances in live cell microscopy have allowed tracking of these pathways by following the dynamics of fluorescently labelled proteins in living cells.
Objectives: This paper explores intelligent data analysis techniques to model the dynamic behavior of proteins in living cells as well as to classify different experimental conditions.
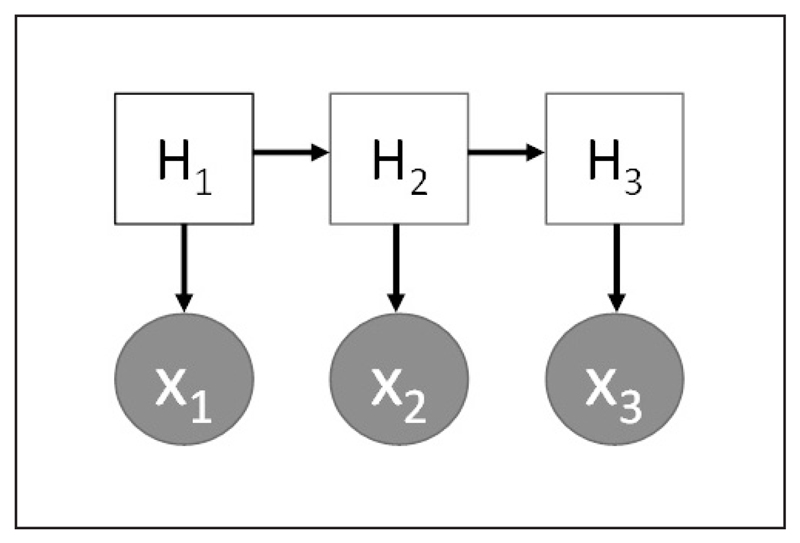
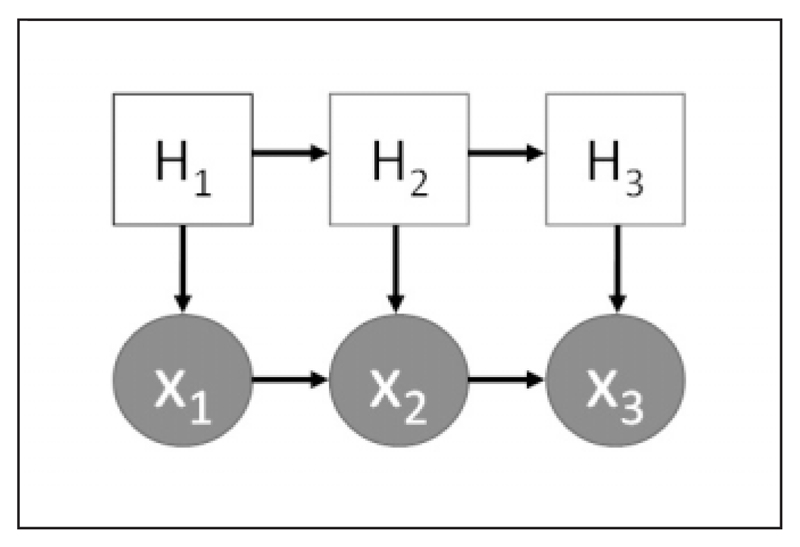
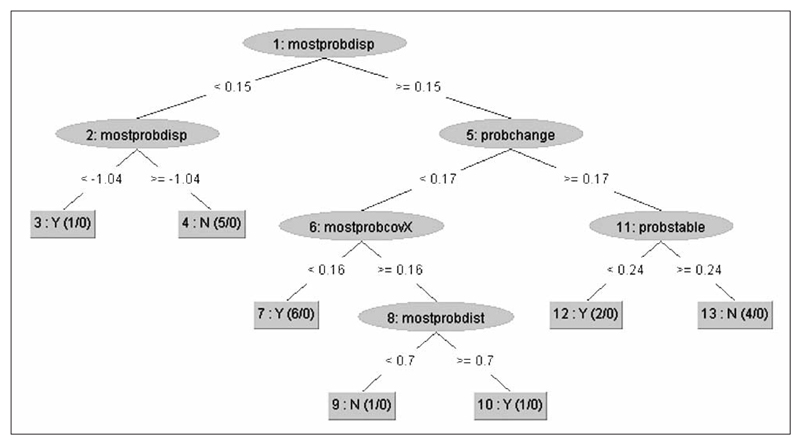
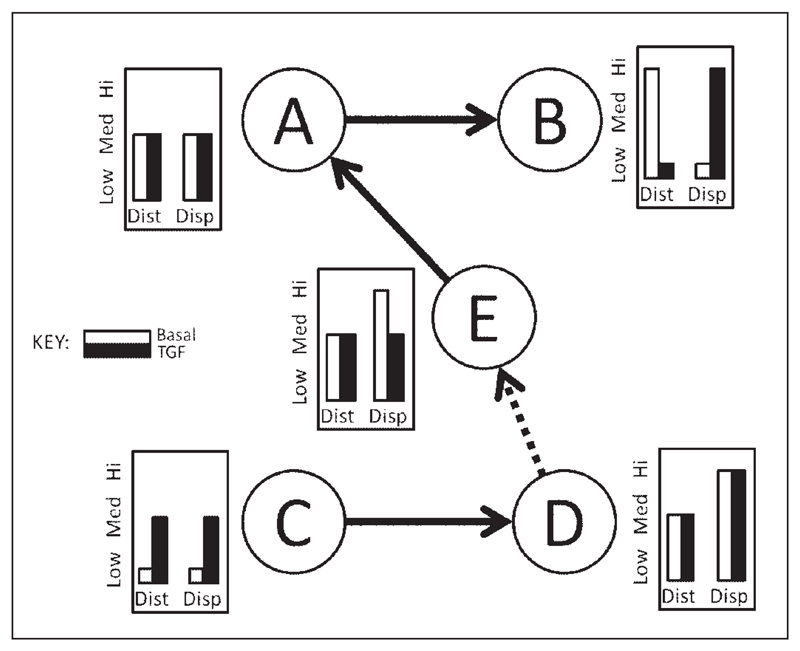
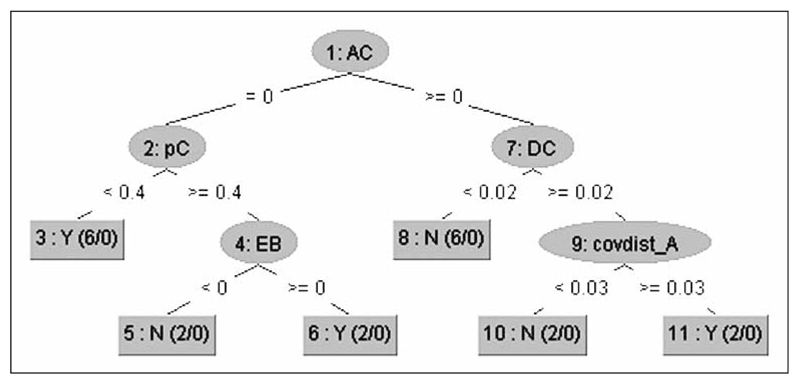
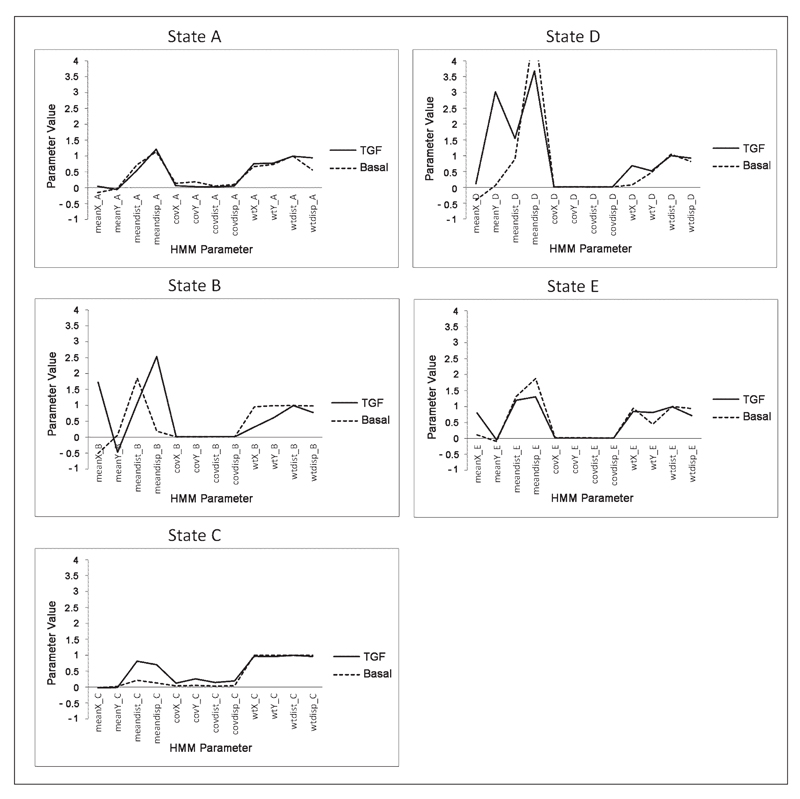
Methods: We use a combination of decision tree classification and hidden Markov models. In particular, we introduce a novel approach to "align" hidden Markov models so that hidden states from different models can be cross-compared.
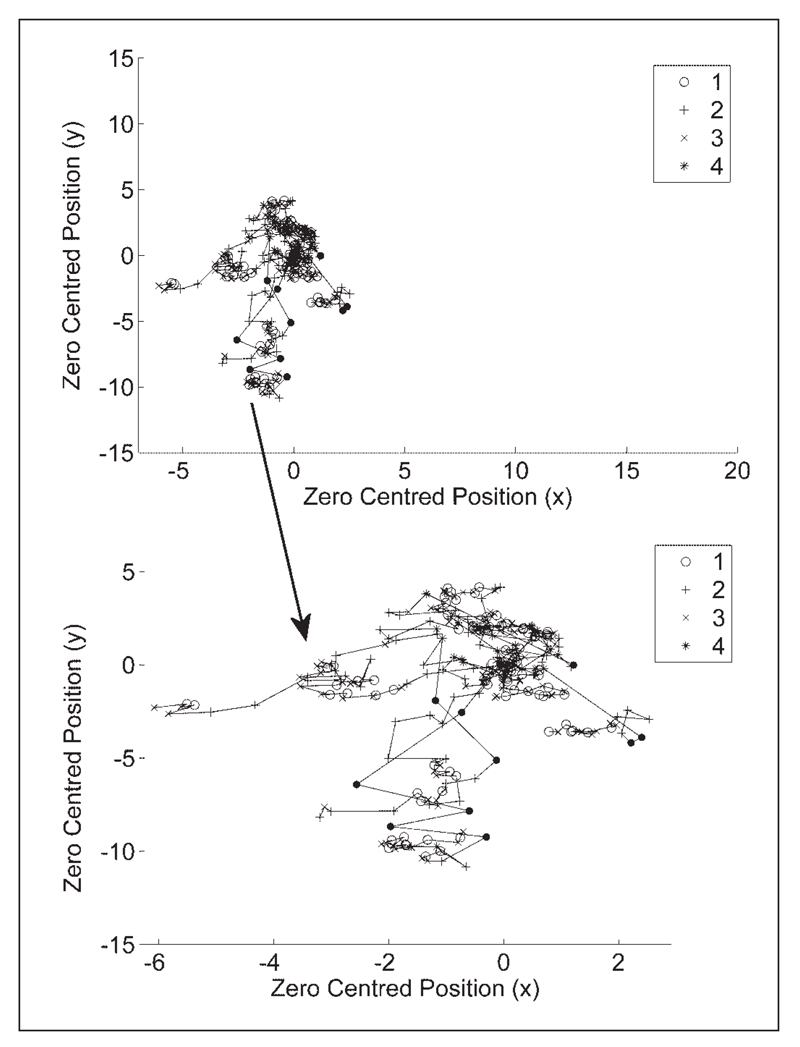
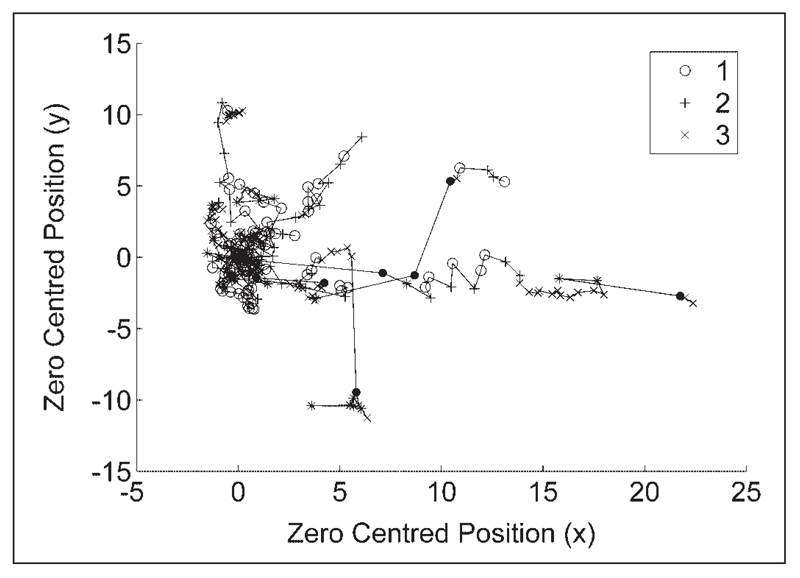
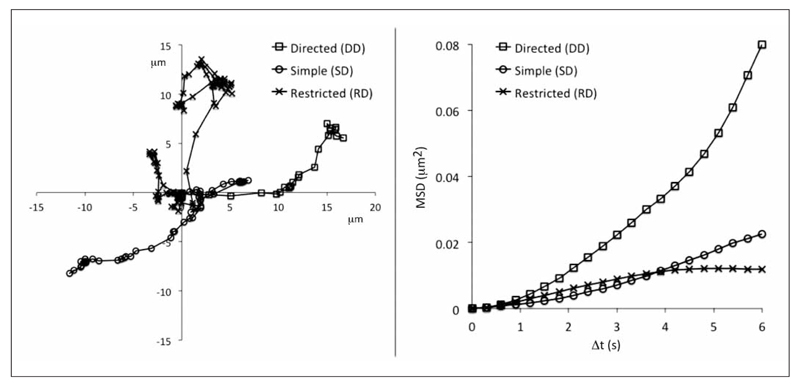
Results: Our models capture the dynamics of two experimental conditions accurately with a stable hidden state for control data and multiple (less stable) states for the experimental data recapitulating the behaviour of particle trajectories within live cell time-lapse data.
Conclusions: In addition to having successfully developed an automated framework for the classification of protein transport dynamics from live cell time-lapse data our model allows us to understand the dynamics of a complex trafficking pathway in living cells in culture.
Figures
Similar articles
-
Temporal models for mitotic phase labelling.Med Image Anal. 2014 Oct;18(7):977-88. doi: 10.1016/j.media.2014.05.003. Epub 2014 May 22. Med Image Anal. 2014. PMID: 24972376
-
A semi-Markov model for mitosis segmentation in time-lapse phase contrast microscopy image sequences of stem cell populations.IEEE Trans Med Imaging. 2012 Feb;31(2):359-69. doi: 10.1109/TMI.2011.2169495. Epub 2011 Sep 26. IEEE Trans Med Imaging. 2012. PMID: 21954199
-
A multiple model probability hypothesis density tracker for time-lapse cell microscopy sequences.Inf Process Med Imaging. 2013;23:110-22. doi: 10.1007/978-3-642-38868-2_10. Inf Process Med Imaging. 2013. PMID: 24683962
-
Imaging morphogenesis.Philos Trans R Soc Lond B Biol Sci. 2017 May 19;372(1720):20150511. doi: 10.1098/rstb.2015.0511. Philos Trans R Soc Lond B Biol Sci. 2017. PMID: 28348248 Free PMC article. Review.
-
Time-lapse imaging beyond the diffraction limit.Methods. 2018 Nov 1;150:32-41. doi: 10.1016/j.ymeth.2018.07.004. Epub 2018 Jul 27. Methods. 2018. PMID: 30056120 Review.
References
-
- Minoshima S, Cross D. In vivo imaging of axonal transport using MRI: aging and Alzheimer's disease. Eur J Nucl Med Mol Imaging. 2008;35(Suppl 1):S89–92. - PubMed
-
- Meulenbelt I, et al. Clusters of biochemical markers are associated with radiographic subtypes of osteoarthritis (OA) in subject with familial OA at multiple sites. The GARP study. Osteoarthritis Cartilage. 2007;15:379–85. - PubMed
-
- Lippincott-Schwartz J. Dynamics of secretory membrane trafficking. Ann N Y Acad Sci. 2004;1038:115–124. - PubMed
-
- Sbalzarini IF, Koumoutsakos P. Feature point tracking and trajectory analysis for video imaging in cell biology. Journal of Structural Biology. 2005;151:182–95. - PubMed
