. 2012 Jul 17;23(1):21-34.
doi: 10.1016/j.devcel.2012.05.014.

Neonatal β cell development in mice and humans is regulated by calcineurin/NFAT

Affiliations

Neonatal β cell development in mice and humans is regulated by calcineurin/NFAT

William R Goodyer et al. Dev Cell. .

Abstract

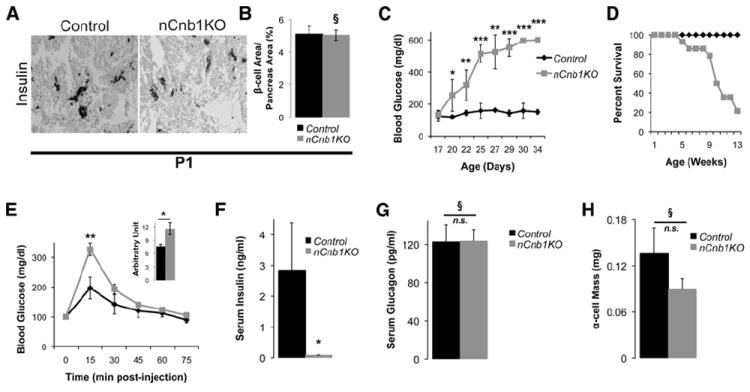
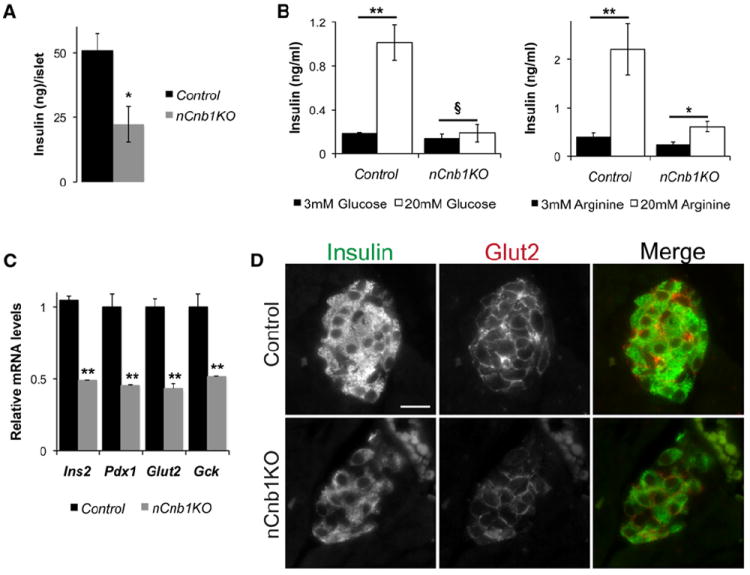
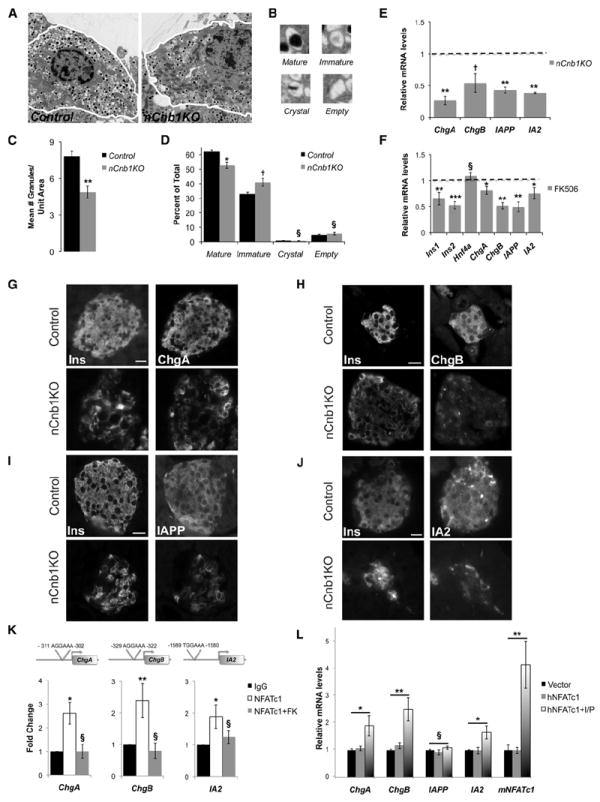
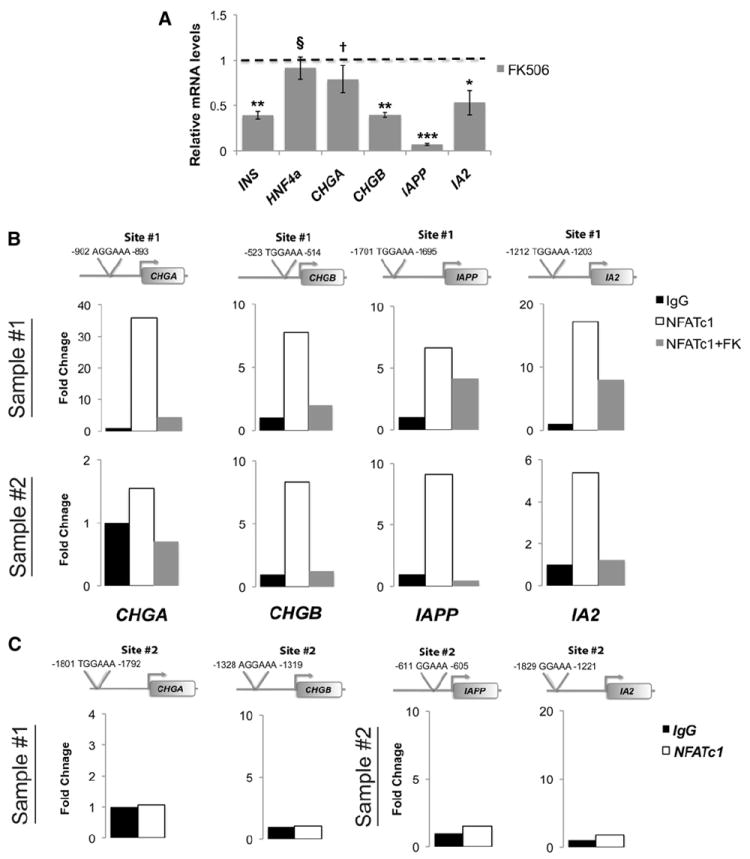
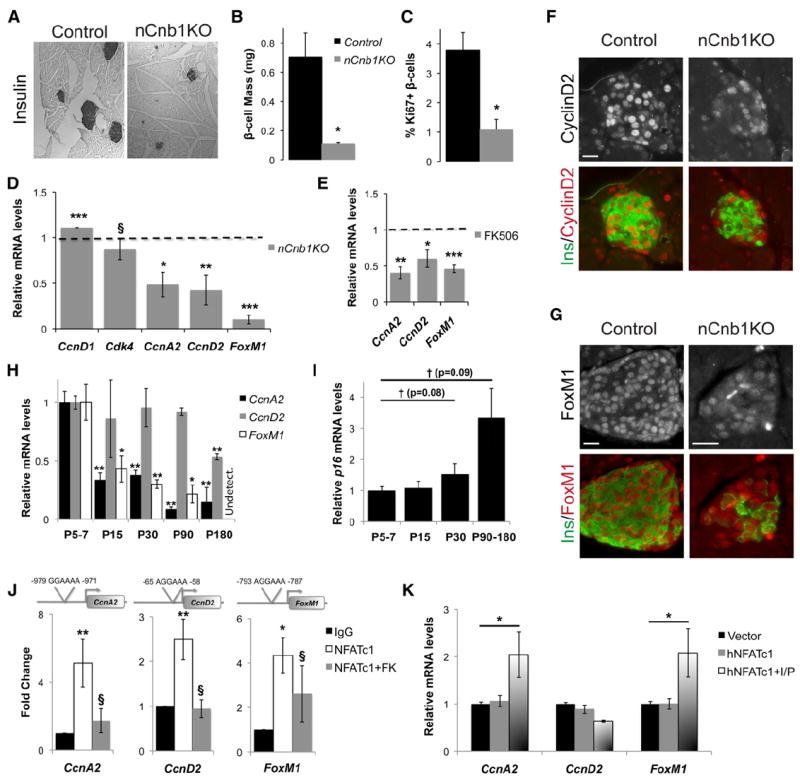
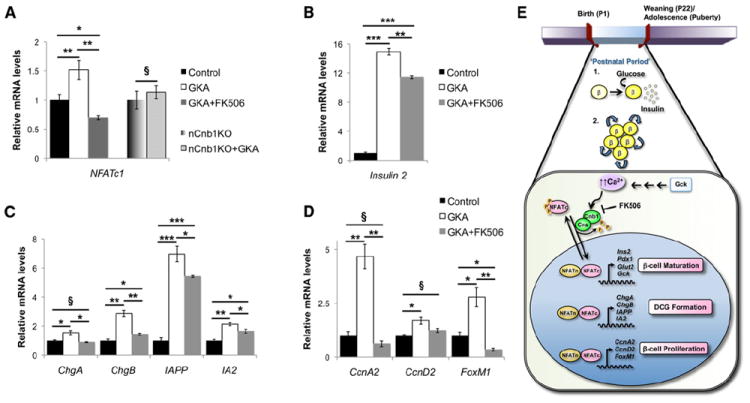
Little is known about the mechanisms governing neonatal growth and maturation of organs. Here we demonstrate that calcineurin/Nuclear Factor of Activated T cells (Cn/NFAT) signaling regulates neonatal pancreatic development in mouse and human islets. Inactivation of calcineurin b1 (Cnb1) in mouse islets impaired dense core granule biogenesis, decreased insulin secretion, and reduced cell proliferation and mass, culminating in lethal diabetes. Pancreatic β cells lacking Cnb1 failed to express genes revealed to be direct NFAT targets required for replication, insulin storage, and secretion. In contrast, glucokinase activation stimulated Cn-dependent expression of these genes. Calcineurin inhibitors, such as tacrolimus, used for human immunosuppression, induce diabetes. Tacrolimus exposure reduced Cn/NFAT-dependent expression of factors essential for insulin dense core granule formation and secretion and neonatal β cell proliferation, consistent with our genetic studies. Discovery of conserved pathways regulating β cell maturation and proliferation suggests new strategies for controlling β cell growth or replacement in human islet diseases.


Figures

Figure 1
Figure 1. nCnb1KO Mice Develop Severe Postnatal Diabetes, Hypoinsulinemia, and Early Onset Lethality
(A and B) Representative insulin immunostaining and quantification of total β cell area/Pancreatic area (in percentage) in postnatal day 1 (P1) control (black bar) and nCnb1KO (gray bar) pancreas (n = 3 per genotype). (C) Blood glucose levels of postnatal nCnb1KO mice (gray lines) and littermate controls (black lines) during ad libitum feeding (n = 4 per genotype minimum per time point). (D) Percent survival of aging mice (n = 31, controls, black lines; n = 14, nCnb1KO, gray lines). (E) Glucose tolerance test performed on P19, normoglycemic mice (n = 5, controls, black; n = 4, nCnb1KO, gray). Inset, area under the curve calculated for indicated genotypes. (F and G) Serum insulin (F) and serum glucagon (G) levels from fasted P26 mice. (H) α cell mass in P26 mice. All data are from both female and male mice and represented as means ± SEM. *p < 0.05, **p < 0.025, ***p < 0.002. §, not significant (n.s.). See also Figure S1.
Figure 2
Figure 2. Decreased Insulin Production and Secretion in nCnb1KO Islets
(A) Whole islet insulin content by insulin EIA in size-matched control (black bars) and nCnb1KO (gray bars) islets assessed on postnatal day 20 (P20). (B) Glucose-stimulated (left) and arginine-stimulated (right) insulin secretion in static culture assays of islets from P20, normoglycemic nCnb1KO and control mice. (C) Quantitative real-time PCR (qRT-PCR) of β cell factors involved in insulin production and secretion, including Insulin 2 (Ins2), pancreatic and duodenal homeobox 1 (Pdx1), glucose transporter 2 (Glut2), and glucokinase (Gck) in P20 nCnb1KO islets as compared to size-matched islets from littermate controls (n = 4 per genotype). All data presented as means ± SEM. *p < 0.05, **p < 0.025, ***p < 0.002. §, not significant (n.s.). (D) Immunohistochemical detection of β cell factors Insulin and Glut2 in P20 nCnb1KO and control pancreatic islets. Scale bar = 10 μM. See also Figure S2.
Figure 3
Figure 3. Dense Core Granule Biogenesis and Maturation in Mouse β Cells Requires Cn/NFAT Signaling
(A) Transmission electron micrographs of postnatal day 20 (P20) control and nCnb1KO β cells. (B) Representative pictures of the four insulin granule types: (1) mature, (2) immature, (3) crystal-containing, and (4) empty. (C and D) Quantification and morphometric analysis of dense core granules (DCGs) from WT (black bars) and nCnb1KO (gray bars) β cells showing (C) number of granules per unit area and (D) abundance of the different granule subtypes (as a percentage of the total number of granules). (E) qRT-PCR of DCG components in P20 nCnb1KO islets as compared to size-matched islets from littermate controls (n = 4 per genotype). Dashed line represents control levels normalized to 1.0. (F) qRT-PCR of β cell factors and DCG components in P20 islets from wild-type (WT), C57BL/6 male mice treated with FK506 (10 μM) or vehicle (EtOH) for 72 hr (n = 5). (G–J) Immunohistochemical detection of DCG components ChgA (G), ChgB (H), IAPP (I), and IA2 (J) in P26 nCnb1KO and control islets. Scale bar = 10 μM. (K) Chromatin immunoprecipitation (ChIP) of NFATc1 at indicated loci in islets isolated and fixed from P20 WT, C57BL/6 mice. Islets were treated for 24 hr with either vehicle (EtOH) or FK506 (10 μM) (n = 4 per condition). ChIP data are presented as fold change of signal relative to IgG background with comparisons to leftmost data bar (black). (L) Relative mRNA levels of indicated genes after in vitro transfection of MIN6 cells with human NFATc1 expression construct (hNFATc1) or empty expression vector (Vector) and treated with either vehicle DMSO or a combination of Ionomycin and PMA (I/P). All data presented as means ± SEM. *p < 0.05, **p < 0.025, ***p < 0.002. §, not significant (n.s.).
Figure 4
Figure 4. Cn/NFAT Signaling Regulates Expression of DCG Components in Human Islets
(A) Relative quantification of mRNAs encoding indicated DCG components in isolated human islets (n = 3) treated with FK506 (10 μM) or vehicle (EtOH) for 72 hr. Dashed line represents vehicle-treated control levels normalized to 1.0. (B) ChIP of NFATc1 on isolated human islets (sample #1: 5 years old, sample #2: 13 years old). Each human sample was divided and treated for 24 hr with either vehicle (EtOH) or FK506 (10 μM). (C) Additional adjacent NFAT consensus sites (“Site #2”) within the indicated gene promoter regions did not bind NFATc1 (see also Table S2). ChIP data are presented as fold change of NFATc1 signal (white bar) or NFATc1+FK506 (gray bar) relative to IgG (black bar) control signal. All data presented as means ± SEM. *p < 0.05, **p < 0.025, ***p < 0.002. †p < 0.15. §, not significant (n.s.)
Figure 5
Figure 5. Mouse Neonatal β Cell Proliferation and Mass Regulated by Cn/NFAT Signaling
(A) Representative insulin stains of Control and nCnb1KO pancreatic tissue at postnatal day 26 (P26). (B) Quantification of β cell mass by morphometry in control (black bar) and nCnb1KO (gray bar) mice. (C) Quantification of β cell proliferation by scoring the percentage of Ki67+ β cells in control (black bar) and nCnb1KO (gray bar) pancreatic islets. (D) Quantification of mRNAs encoding indicated cell cycle regulators in P20 nCnb1KO islets and size-matched control islets (n = 4 per genotype). Dashed line represents control levels normalized to 1.0. (E) mRNA quantification of CcnA2, CcnD2, and FoxM1 in P20 islets from WT C57BL/6J male mice treated with FK506 (10 μM) or vehicle (EtOH) for 72 hr (n = 5). Dashed line represents control levels normalized to 1.0. (F and G) Immunohistochemical detection of Cyclin D2 (F), gray, or red in merge), and FoxM1 (G), gray, or red in merge) in P26 nCnb1KO and control pancreatic islets. Insulin (Ins) in green. Scale bar = 10 μM. (H and I) qRT-PCR time course of cell cycle regulators in FACS-isolated β cells from MIP-GFP mice at indicated ages (n = 4, 2, 3, 2, 2 at each time point, respectively). (J) ChIP of NFATc1 on indicated loci from islets isolated and fixed from P20 wild-type, C57BL/6 mice. Islets were treated for 24 hr with either vehicle (EtOH) or FK506 (10 μM) (n = 4 per condition). ChIP data are presented as fold change of NFATc1 (white bar) or NFATc1+FK506 (gray bar) signal relative to IgG (black bar) background signal. (K) Quantification of mRNA levels of indicated genes after in vitro transfection of MIN6 cells with human NFATc1 expression construct (hNFATc1) or empty expression vector (Vector) treated with either Ionomycin and PMA (I/P) or vehicle DMSO. All data presented as means ± SEM. *p < 0.05, **p < 0.025, ***p < 0.002. §, not significant (n.s.), with comparisons to leftmost data bar (black), unless otherwise noted.
Figure 6
Figure 6. CCNA2, CCND2, and FOXM1 mRNA Levels Peak during the Neonatal Period in Human Islets, and Cn/NFAT Regulates Their Expression
(A–D) qRT-PCR time course of CCNA2, CCND2, FOXM1, and CDK2 mRNA transcript levels in isolated islets from humans of increasing age (n = 2, except time point “39-56 y”, where n = 4). (E) ChIP of NFATc1 at indiated loci from isolated human islets (sample #1: 5 years old, sample #2: 13 years old) treated for 24 hr with either vehicle (EtOH) or FK506 (10 μM). Note: Sample #1 was only treated with vehicle because of limited islet yield from donor sample. Additional adjacent NFAT consensus sites (“Site #2”) within the gene promoter region did not bind NFATc1 (see also Table S2). ChIP data are presented as fold change of NFATc1 signal (white bar) or NFATc1+FK506 (gray bar) relative to IgG (black bar) control signal. (F) mRNA quantification of indicated genes in isolated human islets (n = 3) treated with FK506 (10 μM) or vehicle (EtOH) for 72 hr. Dashed line represents vehicle-treated control levels normalized to 1.0. (G and H) Quantification of BrdU+ insulin+ cells as a percentage of all insulin+ cells in islets isolated from a 4-year-old human donor pancreas. Islets were divided and exposed to vehicle (DMSO) or FK506 (10 μM) (see Experimental Procedures). (H) Representative immunofluorescence staining of insulin+BrdU+ double-positive cells (arrowheads) from 4-year-old donor islets. Insulin (green) and BrdU (red). All data presented as means ± SEM. *p < 0.05, **p < 0.025, ***p < 0.002. §, not significant (n.s.).
Figure 7
Figure 7. Glucokinase Activator Induces Transcription of NFATc1 and Its Targets in a Calcineurin-Dependent Manner
(A–D) Islets isolated from postnatal (P10) control C57Bl/6 or nCnb1KO mice treated with either vehicle, glucokinase activator (GKA) R0-28-1675 (10 μM) or GKA+FK506 (10 μM each) for 72 hr (n = 3 minimum per condition). qRT-PCR of (A) NFATc1, (B) Insulin 2, (C) indicated DCG components, and (D) indicated cell cycle regulators. (E) Schematic summarizing a role for Cn/NFAT signaling in postnatal β cell (1) maturation and (2) proliferation via the direct transcriptional regulation of key β cell genes. Ins2 (insulin 2), Pdx1 (pancreatic duodenal homeobox 1), Glut2 (glucose transporter type 2), Gck (glucokinase), ChgA/B (chromogranins A and B), IAPP (islet amyloid polypeptide), IA2 (ICA512), CcnA2 (cyclinA2), CcnD2 (cyclinD2), and FoxM1 (forkhead homeobox factor M1). All data are from male mice and are represented as means ± SEM. *p < 0.05, **p < 0.025, ***p < 0.002. §, not significant (n.s.). See also Figure S3.

Comment in

References

    1. Ackermann Misfeldt A, Costa RH, Gannon M. Beta-cell proliferation, but not neogenesis, following 60% partial pancreatectomy is impaired in the absence of FoxM1. Diabetes. 2008;57:3069–3077. - PMC - PubMed
    1. Aguayo-Mazzucato C, Koh A, El Khattabi I, Li W-C, Toschi E, Jermendy A, Juhl K, Mao K, Weir GC, Sharma A, Bonner-Weir S. Mafa expression enhances glucose-responsive insulin secretion in neonatal rat beta cells. Diabetologia. 2011;54:583–593. - PMC - PubMed
    1. Ahlgren U, Jonsson J, Jonsson L, Simu K, Edlund H. beta-cell-specific inactivation of the mouse Ipf1/Pdx1 gene results in loss of the beta-cell phenotype and maturity onset diabetes. Genes Dev. 1998;12:1763–1768. - PMC - PubMed
    1. Arnette D, Gibson TB, Lawrence MC, January B, Khoo S, McGlynn K, Vanderbilt CA, Cobb MH. Regulation of ERK1 and ERK2 by glucose and peptide hormones in pancreatic beta cells. J Biol Chem. 2003;278:32517–32525. - PubMed
    1. Arron JR, Winslow MM, Polleri A, Chang C-P, Neilson JR, Heit JJ, Kim SK, Francke U, Graef IA, Crabtree GR. NFAT dysregulation by increased dosage of DSCR1 and DYRK1a on chromosome 21. Nature. 2006;441:595–600. - PubMed

Publication types

MeSH terms

LinkOut - more resources