

Association between socioeconomic status and self-reported diabetes in India: a cross-sectional multilevel analysis
- PMID: 22815470
- PMCID: PMC3401832
- DOI: 10.1136/bmjopen-2012-000895
Association between socioeconomic status and self-reported diabetes in India: a cross-sectional multilevel analysis
Abstract
Objectives: To quantify the association between socioeconomic status (SES) and type 2 diabetes in India.
Design: Nationally representative cross-sectional household survey.
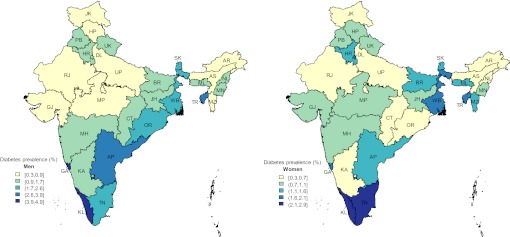
Setting: Urban and rural areas across 29 states in India.
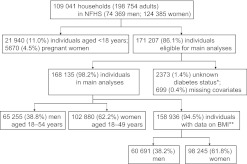
Participants: 168 135 survey respondents aged 18-49 years (women) and 18-54 years (men).
Primary outcome measure: Self-reported diabetes status.
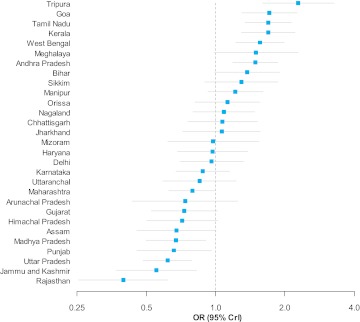
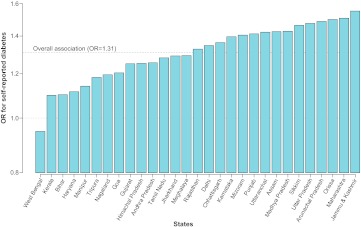
Results: Markers of SES were social caste, household wealth and education. The overall prevalence of self-reported diabetes was 1.5%; this increased to 1.9% and 2.5% for those with the highest levels of education and household wealth, respectively. In multilevel logistic regression models (adjusted for age, gender, religion, marital status and place of residence), education (OR 1.87 for higher education vs no education) and household wealth (OR 4.04 for richest quintile vs poorest) were positively related to self-reported diabetes (p<0.0001). In a fully adjusted model including all socioeconomic variables and body mass index, household wealth emerged as positive and statistically significant with an OR for self-reported diabetes of 2.58 (95% credible interval (CrI): 1.99 to 3.40) for the richest quintile of household wealth versus the poorest. Nationally in India, a one-quintile increase in household wealth was associated with an OR of 1.31 (95% CrI 1.20 to 1.42) for self-reported diabetes. This association was consistent across states with the relationship found to be positive in 97% of states (28 of 29) and statistically significant in 69% (20 of 29 states).
Conclusions: The authors found that the highest SES groups in India appear to be at greatest risk for type 2 diabetes. This raises important policy implications for addressing the disease burdens among the poor versus those among the non-poor in the context of India, where >40% of the population is living in poverty.
Conflict of interest statement
Figures
References
-
- Rao KS, Mukherjee NR, Rao KV. A survey of diabetes mellitus in a rural population of India. Diabetes 1972;21:1192–6 - PubMed
-
- Gupta OP, Joshi MH, Dave SK. Prevalence of diabetes in India. Adv Metab Disord 1978;9:147–65 - PubMed
-
- Ahuja MM. Recent contributions to the epidemiology of diabetes mellitus in India. Int J Diab Developing Countries 1991;11:5–9
-
- Ramachandran A, Snehalatha C, Kapur A, et al. High prevalence of diabetes and impaired glucose tolerance in India: National Urban Diabetes Survey. Diabetologia 2001;44:1094–101 - PubMed
-
- Sadikot SM, Nigam A, Das S, et al. The burden of diabetes and impaired glucose tolerance in India using the WHO 1999 criteria: prevalence of diabetes in India study (PODIS). Diabetes Res Clin Pract 2004;66:301–7 - PubMed
LinkOut - more resources
Full Text Sources