

Determinants of taste preference and acceptability: quality versus hedonics
- PMID: 22815522
- PMCID: PMC3422882
- DOI: 10.1523/JNEUROSCI.6036-11.2012
Determinants of taste preference and acceptability: quality versus hedonics
Abstract
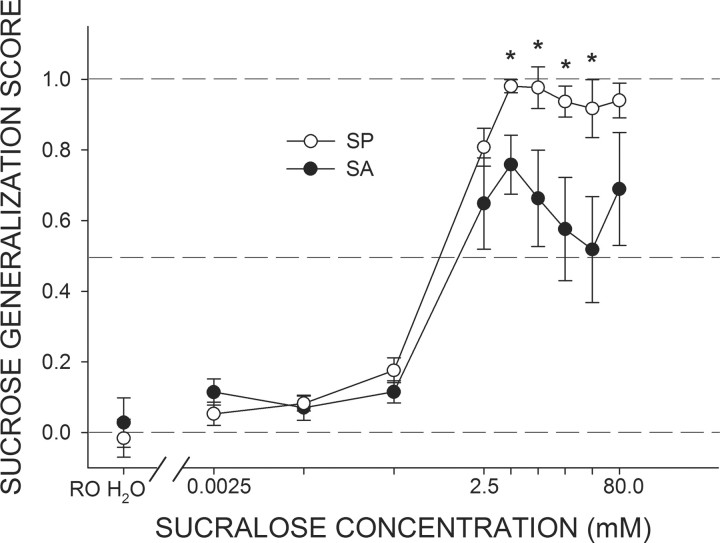
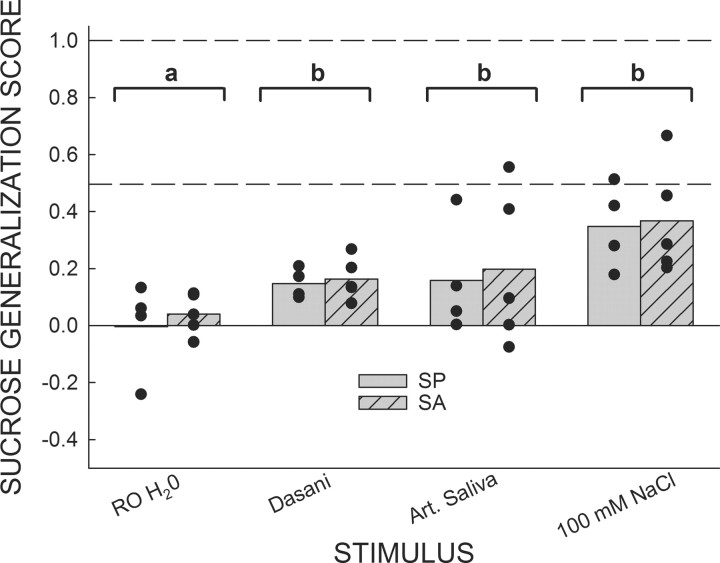
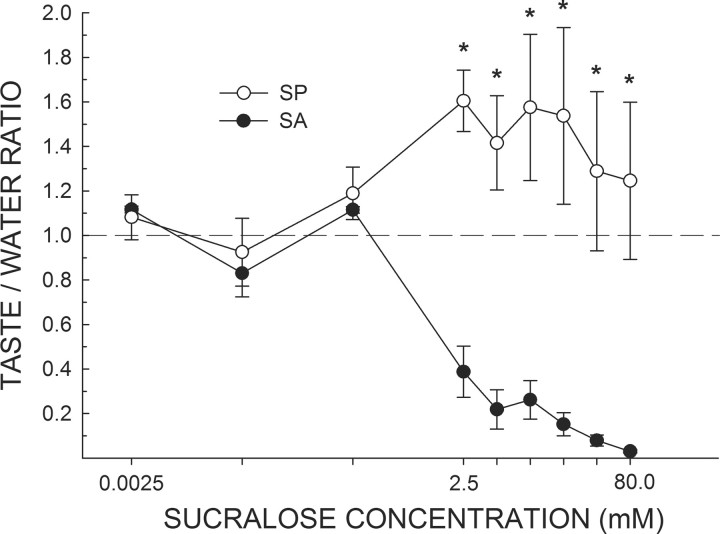
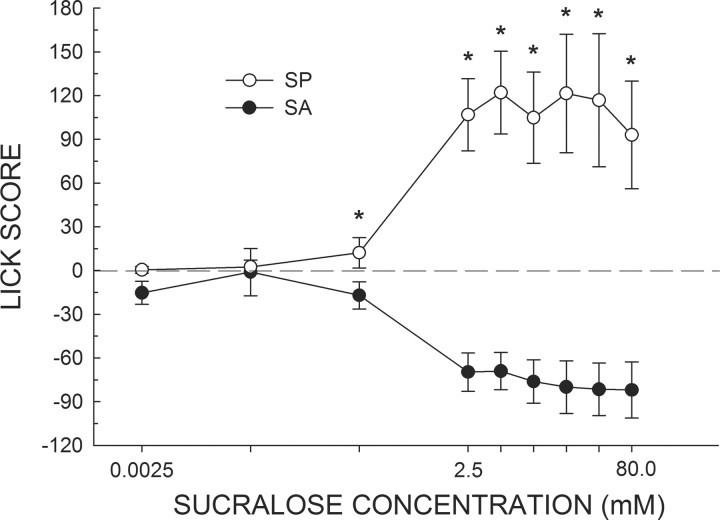
Several methods exist for reliably determining the motivational valence of a taste stimulus in animals, but few to determine its perceptual quality independent of its apparent affective properties. Individual differences in taste preference and acceptability could result from variance in the perceptual qualities of the stimulus leading to different hedonic evaluations. Alternatively, taste perception might be identical across subjects, but the processing of the sensory signals in reward circuits could differ. Using an operant-based taste cue discrimination/generalization task involving a gustometer, we trained male Long-Evans rats to report the degree to which a test stimulus resembled the taste quality of either sucrose or quinine regardless of its intensity. The rats, grouped by a characteristic bimodal phenotypic difference in their preference for sucralose, treated this artificial sweetener as qualitatively different-compared to sucralose-avoiding rats, the sucralose-preferring rats found the stimulus much more perceptually similar to sucrose. Although the possibility that stimulus palatability may have served as a discriminative cue cannot entirely be ruled out, the profile of results suggests otherwise. Subsequent brief-access licking tests revealed that affective licking responses of the same sucralose-avoiding and -preferring rats differed across concentration in a manner approximately similar to that found in the stimulus generalization task. Thus, the perceived taste quality of sucralose alone may be sufficient to drive the observed behavioral avoidance of the compound. By virtue of its potential ability to dissociate the sensory and motivational consequences of a given experimental manipulation on taste-related behavior, this approach could be interpretively valuable.
Conflict of interest statement
The authors declare no financial conflicts of interest.
Figures
Similar articles
-
Stability of individual differences in sucralose taste preference.PLoS One. 2019 May 14;14(5):e0216431. doi: 10.1371/journal.pone.0216431. eCollection 2019. PLoS One. 2019. PMID: 31086418 Free PMC article.
-
Examination of the perception of sweet- and bitter-like taste qualities in sucralose preferring and avoiding rats.Physiol Behav. 2015 Mar 1;140:96-103. doi: 10.1016/j.physbeh.2014.12.023. Epub 2014 Dec 10. Physiol Behav. 2015. PMID: 25497078 Free PMC article.
-
Preference for sucralose predicts behavioral responses to sweet and bittersweet tastants.Chem Senses. 2012 Jun;37(5):445-53. doi: 10.1093/chemse/bjr126. Epub 2012 Jan 25. Chem Senses. 2012. PMID: 22281530 Free PMC article.
-
Chorda tympani responses in two inbred strains of mice with different taste preferences.Physiol Behav. 1999 Aug;67(2):287-97. doi: 10.1016/s0031-9384(99)00071-2. Physiol Behav. 1999. PMID: 10477061 Review.
-
Roles of hormones in taste signaling.Results Probl Cell Differ. 2010;52:115-37. doi: 10.1007/978-3-642-14426-4_10. Results Probl Cell Differ. 2010. PMID: 20865376 Free PMC article. Review.
Cited by
-
Stability of individual differences in sucralose taste preference.PLoS One. 2019 May 14;14(5):e0216431. doi: 10.1371/journal.pone.0216431. eCollection 2019. PLoS One. 2019. PMID: 31086418 Free PMC article.
-
Examination of the perception of sweet- and bitter-like taste qualities in sucralose preferring and avoiding rats.Physiol Behav. 2015 Mar 1;140:96-103. doi: 10.1016/j.physbeh.2014.12.023. Epub 2014 Dec 10. Physiol Behav. 2015. PMID: 25497078 Free PMC article.
-
Cocaine decreases saccharin preference without altering sweet taste sensitivity.Pharmacol Biochem Behav. 2015 Jun;133:18-24. doi: 10.1016/j.pbb.2015.03.010. Epub 2015 Mar 24. Pharmacol Biochem Behav. 2015. PMID: 25812471 Free PMC article.
-
Bitter-Induced Salivary Proteins Increase Detection Threshold of Quinine, But Not Sucrose.Chem Senses. 2019 Jul 17;44(6):379-388. doi: 10.1093/chemse/bjz021. Chem Senses. 2019. PMID: 31053859 Free PMC article.
-
Breadth of tuning in taste afferent neurons varies with stimulus strength.Nat Commun. 2015 Sep 16;6:8171. doi: 10.1038/ncomms9171. Nat Commun. 2015. PMID: 26373451 Free PMC article.
References
-
- Bartoshuk LM. Taste mixtures: is mixture suppression related to compression? Physiol Behav. 1975;14:643–649. - PubMed
-
- Bartoshuk LM. Water taste in mammals. In: Weijnen J, Mendelson J, editors. Drinking behavior. New York: Plenium; 1977. pp. 317–339.
-
- Carroll ME, Morgan AD, Anker JJ, Perry JL, Dess NK. Selective breeding for differential saccharin intake as an animal model of drug abuse. Behav Pharmacol. 2008;19:435–460. - PubMed
-
- Chandrashekar J, Mueller KL, Hoon MA, Adler E, Feng L, Guo W, Zuker CS, Ryba NJ. T2Rs function as bitter taste receptors. Cell. 2000;100:703–711. - PubMed
-
- Cromwell HC, Berridge KC. Where does damage lead to enhanced food aversion: the ventral pallidum/substantia innominate or lateral hypothalamus? Brain Res. 1993;624:1–10. - PubMed
Publication types
MeSH terms
Substances
Grants and funding
LinkOut - more resources
Full Text Sources
Medical