

Measures of growth in children at risk for Huntington disease
- PMID: 22815549
- PMCID: PMC3414667
- DOI: 10.1212/WNL.0b013e3182648b65
Measures of growth in children at risk for Huntington disease
Abstract
Objective: The effect of mHTT on human development was examined by evaluating measures of growth in children at risk for Huntington disease (HD).
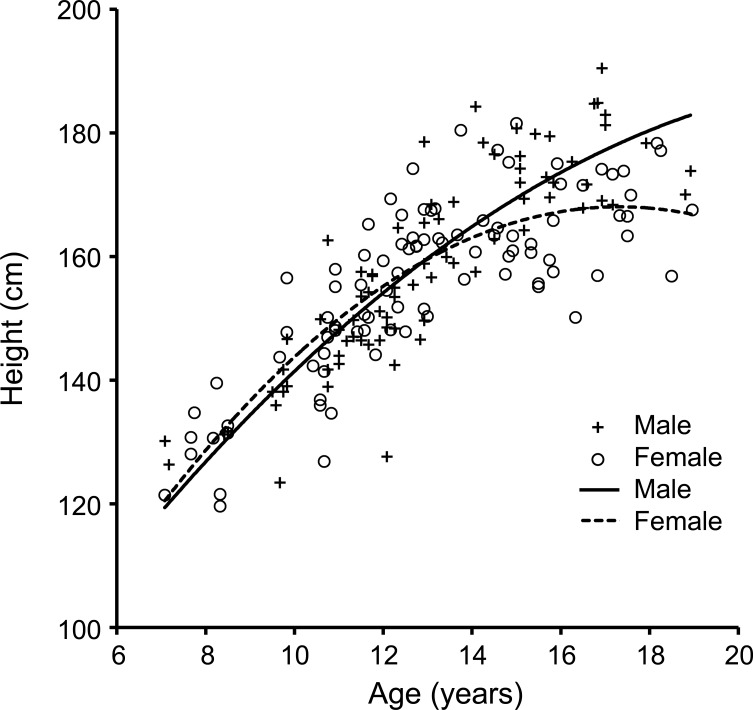
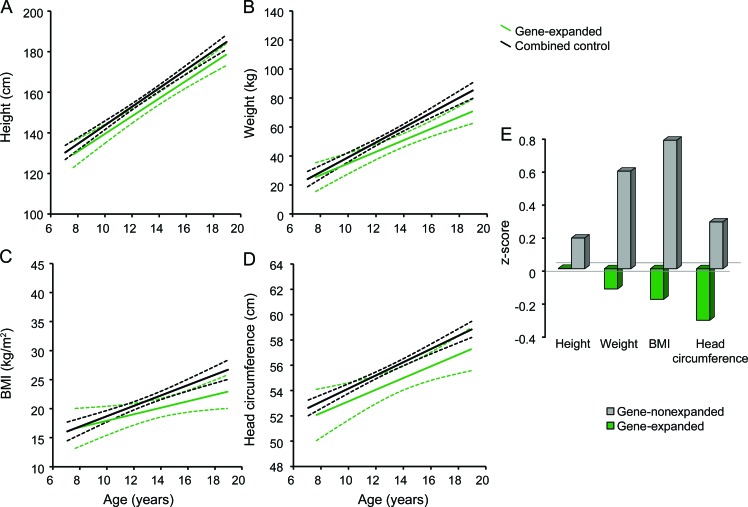
Methods: Children at risk for HD with no manifest symptoms (no juvenile HD included) were enrolled and tested for gene expansion for research purposes only. Measurements of growth (height, weight, body mass index [BMI], and head circumference) in children tested as gene-expanded (n = 20, 7-18 years of age, CAG repeats ≥39) were compared to those of a large database of healthy children (n = 152, 7-18 years of age).
Results: Gene-expanded children had significantly lower measures of head circumference, weight, and BMI. Head circumference was abnormally low even after correcting for height, suggesting a specific deficit in brain growth, rather than a global growth abnormality.
Conclusions: These results indicate that, compared to a control population, children who were estimated to be decades from HD diagnosis have significant differences in growth. Further, they suggest that mHTT may play a role in atypical somatic, and in particular, brain development.
Figures
Comment in
-
Development and neurodegeneration: turning HD pathogenesis on its head.Neurology. 2012 Aug 14;79(7):621-2. doi: 10.1212/WNL.0b013e3182648bfe. Epub 2012 Jul 18. Neurology. 2012. PMID: 22815547 No abstract available.
References
-
- Orth M, Cooper JM, Bates GP, Schapira AH. Inclusion formation in Huntington's disease R6/2 mouse muscle cultures. J Neurochem 2003; 87: 1– 6 - PubMed
-
- Farrer LA, Yu PL. Anthropometric discrimination among affected, at-risk, and not-at-risk individuals in families with Huntington disease. Am J Med Genet 1985; 21: 307– 316 - PubMed