. 2012;7(7):e39794.
doi: 10.1371/journal.pone.0039794. Epub 2012 Jul 16.

Expression of Ccl11 associates with immune response modulation and protection against neuroinflammation in rats

Affiliations

Expression of Ccl11 associates with immune response modulation and protection against neuroinflammation in rats

Milena Z Adzemovic et al. PLoS One. 2012.

Abstract

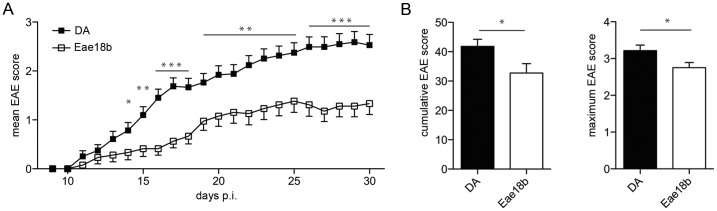
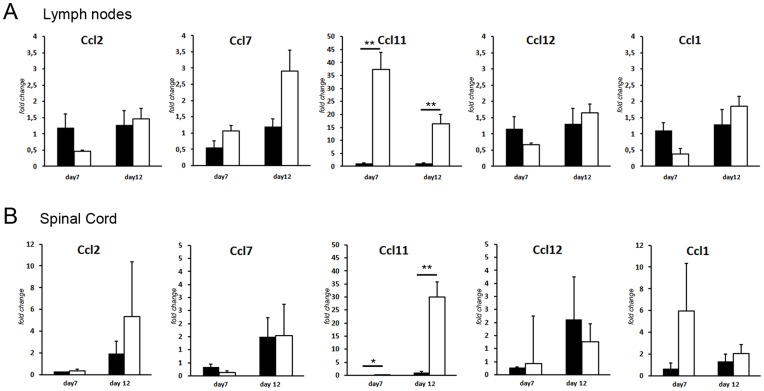
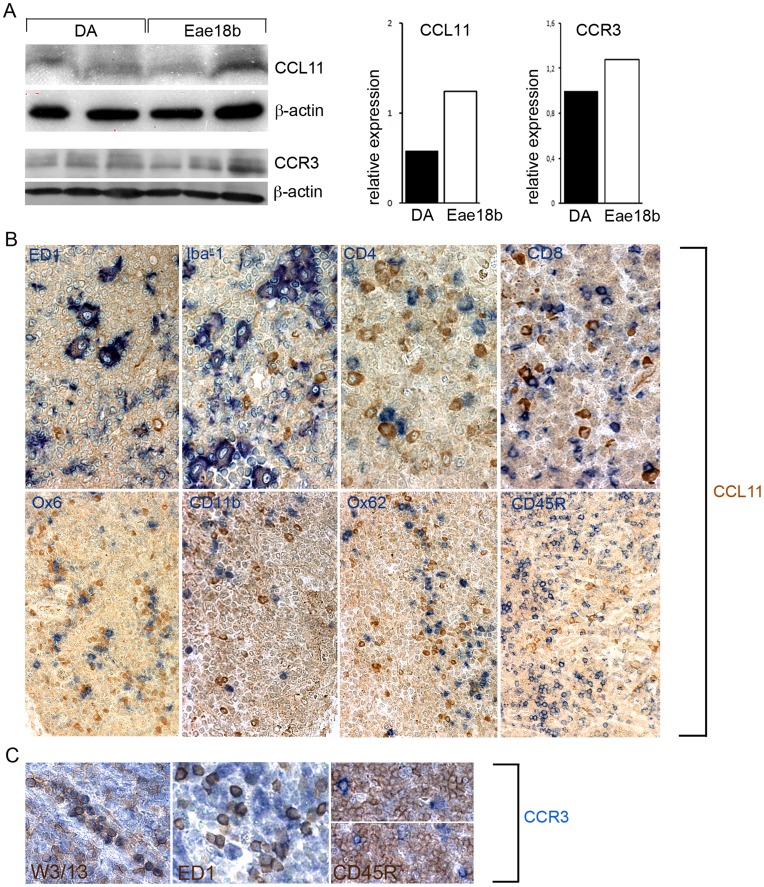
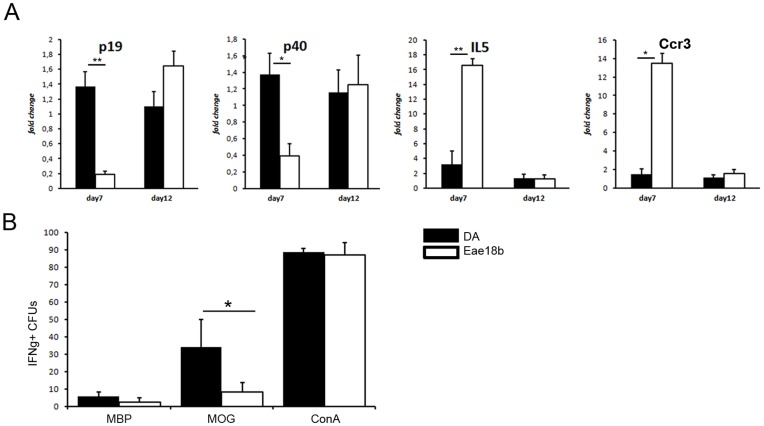
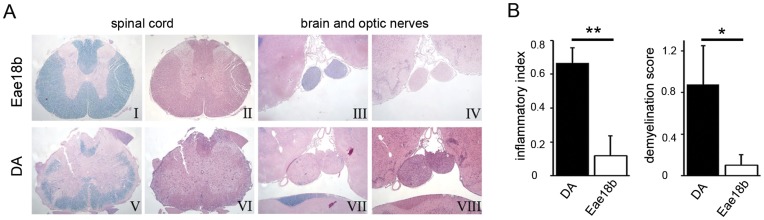
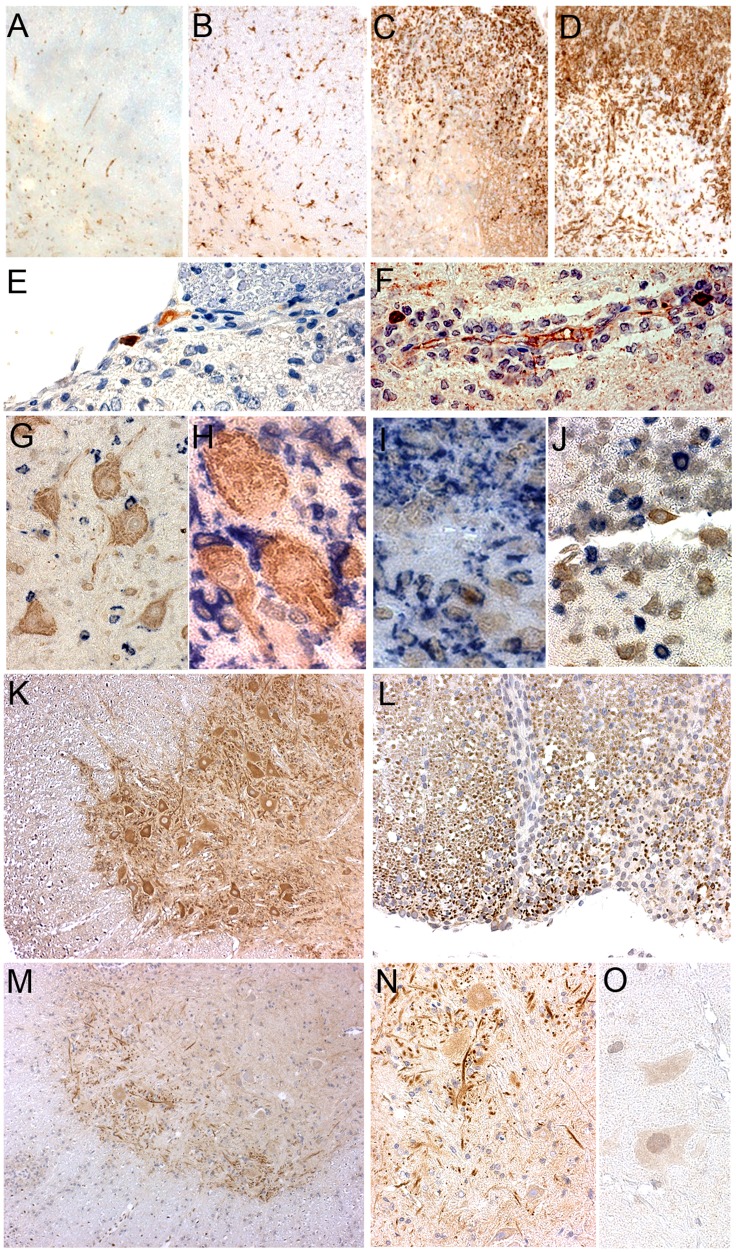
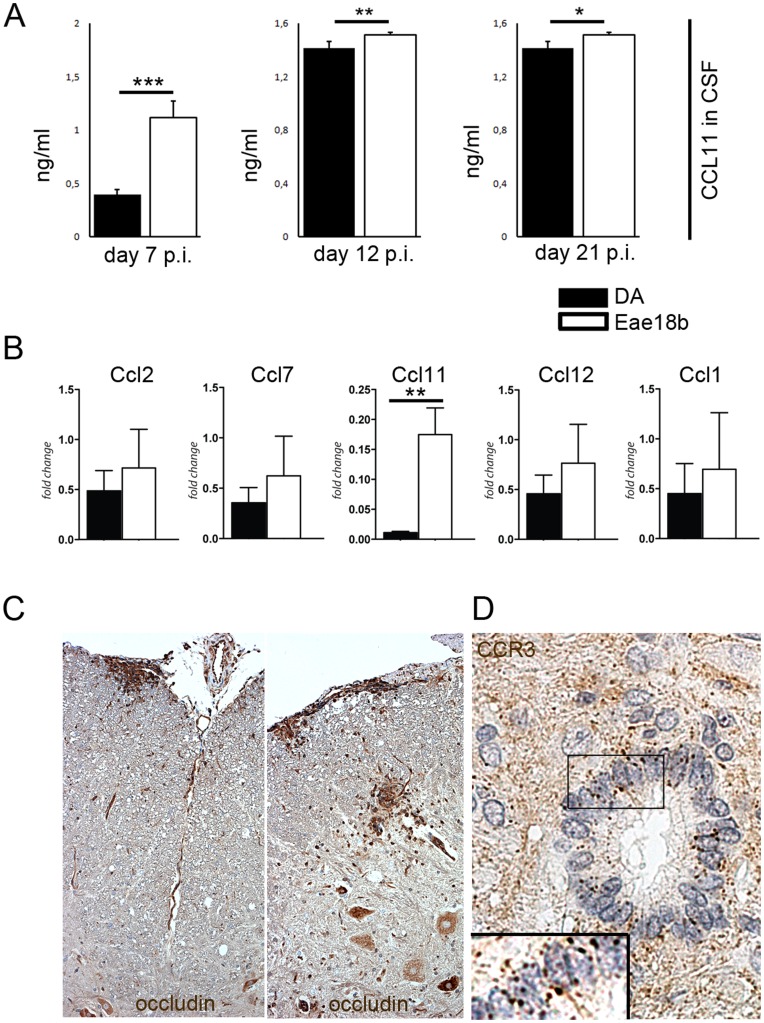
Multiple sclerosis (MS) is a polygenic disease characterized by inflammation and demyelination in the central nervous system (CNS), which can be modeled in experimental autoimmune encephalomyelitis (EAE). The Eae18b locus on rat chromosome 10 has previously been linked to regulation of beta-chemokine expression and severity of EAE. Moreover, the homologous chemokine cluster in humans showed evidence of association with susceptibility to MS. We here established a congenic rat strain with Eae18b locus containing a chemokine cluster (Ccl2, Ccl7, Ccl11, Ccl12 and Ccl1) from the EAE- resistant PVG rat strain on the susceptible DA background and utilized myelin oligodendrocyte glycoprotein (MOG)-induced EAE to characterize the mechanisms underlying the genetic regulation. Congenic rats developed a milder disease compared to the susceptible DA strain, and this was reflected in decreased demyelination and in reduced recruitment of inflammatory cells to the brain. The congenic strain also showed significantly increased Ccl11 mRNA expression in draining lymph nodes and spinal cord after EAE induction. In the lymph nodes, macrophages were the main producers of CCL11, whereas macrophages and lymphocytes expressed the main CCL11 receptor, namely CCR3. Accordingly, the congenic strain also showed significantly increased Ccr3 mRNA expression in lymph nodes. In the CNS, the main producers of CCL11 were neurons, whereas CCR3 was detected on neurons and CSF producing ependymal cells. This corresponded to increased levels of CCL11 protein in the cerebrospinal fluid of the congenic rats. Increased intrathecal production of CCL11 in congenic rats was accompanied by a tighter blood brain barrier, reflected by more occludin(+) blood vessels. In addition, the congenic strain showed a reduced antigen specific response and a predominant anti-inflammatory Th2 phenotype. These results indicate novel mechanisms in the genetic regulation of neuroinflammation.


Conflict of interest statement

Competing Interests: The authors have read the journal’s policy and have the following conflicts: Milena Zeitelhofer-Adzemovic was partly funded by a research grant from Biogen Idec, Inc. This does not alter the authors’ adherence to all the PLoS ONE policies on sharing data and materials.

Figures

Figure 1
Figure 1. Congenic DA.PVG-Eae18b rats display clinically milder EAE.
(A) Mean daily EAE score from 51 DA and 39 DA.PVG-Eae18b (Eae18b) rats, immunized with MOG, p.i: post immunization. The graph includes daily mean scores from all immunized animals in two independent experiments. (B) Mean cumulative EAE score and mean EAE maximum score in affected rats (44 DA and 20 DA.PVG-Eae18b animals). Error bars represent SEM, and (*) indicates p-value <0.05, (**) indicates p-value <0.01, (***) indicates p-value <0.001.
Figure 2
Figure 2. Eae18b congenic animals significantly upregulate Ccl11 mRNA.
qPCR was used to measure mRNA expression of Ccl2, Ccl7, Ccl11, Ccl12 and Ccl1 in draining lymph nodes (A) and spinal cord tissue (B) on day 7 and 12 p.i. Ccl11 mRNA was significantly upregulated in the congenic strain in both lymph node and spinal cord tissue at both time-points. Five to eight animals per strain were used at each time-point and experiments were repeated three times. Error bars represent SEM, statistics were calculated using Mann-Whitney non-parametric test, (*) indicates p-value <0.05, (**) indicates p-value <0.01.
Figure 3
Figure 3. CCL11 and CCR3 protein levels in the inguinal lymph nodes.
(A) Western blot analysis of CCL11 and its main receptor CCR3 in inguinal lymph nodes on day 7 p.i. Protein levels of both targets were increased in the congenic animals compared to the controls (data normalized to β- actin). CCL11, CCR3 and β- actin shown in original representative blots and graphically; three blots performed for each target within two separate EAE experiments. (B) Co-staining with antibodies directed against CCL11 and other immune cell types on paraffin cross sections of inguinal lymph nodes performed on day 7 p.i. in the congenic Eae18b strain. CCL11 co-localized with the macrophage/microglia markers ED1 and Iba-1 (first two images from the left, upper row). CCL11 was not expressed by CD4+ and CD8+ T cells (last two images, upper row). CCL11 was also not detected in MHC class II+ (Ox6+) and CD11b+ populations, neither in Ox62+ dendritic, nor in CD45RA+ B cells (second row, from left to right). (C) The main CCL11 receptor CCR3 was detected on W3/13+ T lymphocytes and ED1+ macrophages, but not on CD45RA+ B cells (five congenic and five control rats analyzed, two whole inguinal lymph nodes per each animal).
Figure 4
Figure 4. Eae18b modulates the immune response and reduces activation of MOG specific T cells.
(A) Pro-inflammatory cytokines p19, p40 were significantly upregulated in controls (DA), while congenic (Eae18b) animals upregulated anti-inflammatory IL-5 cytokine as well as CCR3, main receptor for CCL11 chemokine (mRNA analysis of the inguinal lymph node tissue collected day 7 and 12 p.i.). Five to eight animals per strain were used in all time points analyzed and experiments were repeated twice. Error bars represent SEM, statistics were calculated using Mann-Whitney non-parametric test, (*) indicates p-value <0.05, (**) indicates p-value <0.01. (B) Elispot analysis revealed less pathogenic IFN-γ producing MOG specific T cells in the Eae18b strain; rat splenocytes harvested on day 15 and 21 p.i., representative data shown.
Figure 5
Figure 5. Congenic DA.PVG-Eae18b rats developed less severe neuroinflammation and demyelination.
(A) Histopathological analysis of the group representative paraffin embedded tissue cross-sections from congenic and control spinal cord (I, II and V, VI, respectively) or brain and optic nerves (III, IV and VII, VIII, respectively) on day 15 p.i. (five congenic and four control animals analyzed). Sections were stained with Klüver (I, III, V, VII) to reveal demyelination and Hämalaun & eosin (II, IV, VI, VIII) to detect inflammatory infiltrates. The congenic strain showed minor subpial demyelination and cell infiltration in the spinal cord (I, II), while the brain and optic nerves remained intact (III, IV). In contrast, the control strain displayed confluent subpial demyelinated lesion of the spinal cord white matter (V, VI) as well as an extensive myelin loss in both optic nerves (VII) accompanied by recruitment of inflammatory cells (VIII). (B) Analysis of the material shown in A. Inflammatory index (I.I., first graph from left) and demyelination score (DM, second graph) are both significantly higher in DA controls compared to Eae18b congenic rats. Error bars represent SEM, and (*) indicates p-value <0.05, (**) indicates p-value <0.01 calculated by Students t-test.
Figure 6
Figure 6. CCL11 and CCR3 expression in the central nervous system of Eae18b congenic rats.
(A–D) Congenic and control group representative spinal cord cross sections stained for ED1 (A, C) and Iba-1 (B, D), both hallmarks for activation of microglia/macrophages (brown). Control rats (C, D) showed upregulation of both markers in contrast to congenics (A, B). (E, F) Portions of the control spinal cord cross section showing IgG+ single positive (golden brown, E) plasma cell and CCL11+/IgG+ double positive (maroon; E, F) plasma cells. (G, H) Congenic spinal cord; ventral horn gray matter portion showing CCL11 in neuronal pericarya, dendrites and axons (brown) together with co-stained ED1+ (G) or Iba-1+ (H) cells (both in blue). (I) Congenic spinal cord portion presenting solitary CCL11+ (golden brown)/ED1+ (blue) macrophage on the inflammation site. (J) CCL11+ plasma cell (golden brown) not co-localizing with CD3+ T cells (blue), here in the control spinal cord cross section. (K) Ventral horn of the congenic spinal cord gray matter not undergoing inflammation showing CCR3 upregulation in neurons, dendrites and axons (brown). (L) Dorsal spinal cord white matter expressing CCR3 (dark brown dots), partially downregulated within demyelinated lesion on the right side of the image. (M, N) Ventral horn of the congenic spinal cord gray matter undergoing inflammation revealing CCR3 downregulation in neurons (brown, in the lower (M, 40×) and a chosen detail in the higher magnification (N, 160×). (O) Negative control; a detail representing resident cells in the ventral horn of the spinal cord gray matter.
Figure 7
Figure 7. Eae18b regulates intrathecal production of CCL11 and influences the BBB integrity.
(A) During the whole disease course CCL11 protein levels were increased in the cerebrospinal fluid (CSF), in the congenics (Eae18b) compared to controls (DA). Experiments repeated twice, three to five animals per group analyzed. (B) mRNA levels of Ccl11 measured in the late disease time point (day 23 p.i.) showed upregulation in the congenic spinal cord. Error bars represent SEM, and (*) indicates p-value <0.05, (**) indicates p-value <0.01, (***) indicates p-value <0.001 calculated by Student’s t-test in (A) and by Mann-Whitney non-parametrical test in (B). (C) Representative images of occludin, a marker for the BBB tight junction components; more abundant in the congenic spinal cord (cross sections of seven congenic and eight control animals analyzed on day 12 p.i.). (D) Representative image of CCR3, the main receptor for CCL11, expressed on ependymal cells of the spinal cord canalis centralis, including a detail in high magnification (160×). Five congenic and four control animals analyzed on day 15 p.i.

References

    1. De Jager PL, Jia X, Wang J, de Bakker PI, Ottoboni L, et al. Meta-analysis of genome scans and replication identify CD6, IRF8 and TNFRSF1A as new multiple sclerosis susceptibility loci. Nat Genet. 2009;41:776–782. - PMC - PubMed
    1. Sawcer S, Hellenthal G, Pirinen M, Spencer CC, Patsopoulos NA, et al. Genetic risk and a primary role for cell-mediated immune mechanisms in multiple sclerosis. Nature. 2011;476:214–219. - PMC - PubMed
    1. De Jager PL, Baecher-Allan C, Maier LM, Arthur AT, Ottoboni L, et al. The role of the CD58 locus in multiple sclerosis. Proc Natl Acad Sci U S A. 2009;106:5264–5269. - PMC - PubMed
    1. Sawcer S. The complex genetics of multiple sclerosis: pitfalls and prospects. Brain. 2008;131:3118–3131. - PMC - PubMed
    1. Storch MK, Stefferl A, Brehm U, Weissert R, Wallström E, et al. Autoimmunity to Myelin Oligodendrocyte Glycoprotein in Rats Mimics the Spectrum of Multiple Sclerosis Pathology Brain Pathol. 1998;8:681–694. - PMC - PubMed

Publication types

MeSH terms

Substances