Genome-wide transcriptional profiles during temperature and oxidative stress reveal coordinated expression patterns and overlapping regulons in rice
- PMID: 22815860
- PMCID: PMC3397947
- DOI: 10.1371/journal.pone.0040899
Genome-wide transcriptional profiles during temperature and oxidative stress reveal coordinated expression patterns and overlapping regulons in rice
Abstract
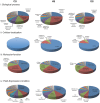
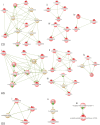
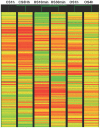
Genome wide transcriptional changes by cold stress, heat stress and oxidative stress in rice seedlings were analyzed. Heat stress resulted in predominant changes in transcripts of heat shock protein and heat shock transcription factor genes, as well as genes associated with synthesis of scavengers of reactive oxygen species and genes that control the level of sugars, metabolites and auxins. Cold stress treatment caused differential expression of transcripts of various transcription factors including desiccation response element binding proteins and different kinases. Transcripts of genes that are part of calcium signaling, reactive oxygen scavenging and diverse metabolic reactions were differentially expressed during cold stress. Oxidative stress induced by hydrogen peroxide treatment, resulted in significant up-regulation in transcript levels of genes related to redox homeostasis and down-regulation of transporter proteins. ROS homeostasis appeared to play central role in response to temperature extremes. The key transcription factors that may underlie the concerted transcriptional changes of specific components in various signal transduction networks involved are highlighted. Co-ordinated expression pattern and promoter architectures based analysis (promoter models and overrepresented transcription factor binding sites) suggested potential regulons involved in stress responses. A considerable overlap was noted at the level of transcription as well as in regulatory modules of differentially expressed genes.
Conflict of interest statement
Figures


Similar articles
-
Gene expression analysis in response to low and high temperature and oxidative stresses in rice: combination of stresses evokes different transcriptional changes as against stresses applied individually.Plant Sci. 2012 Dec;197:102-13. doi: 10.1016/j.plantsci.2012.09.008. Epub 2012 Sep 25. Plant Sci. 2012. PMID: 23116677
-
An early response regulatory cluster induced by low temperature and hydrogen peroxide in seedlings of chilling-tolerant japonica rice.BMC Genomics. 2007 Jun 18;8:175. doi: 10.1186/1471-2164-8-175. BMC Genomics. 2007. PMID: 17577400 Free PMC article.
-
Genome-wide analysis of the complex transcriptional networks of rice developing seeds.PLoS One. 2012;7(2):e31081. doi: 10.1371/journal.pone.0031081. Epub 2012 Feb 17. PLoS One. 2012. PMID: 22363552 Free PMC article.
-
[Heat Shock Proteins in Plant Protection from Oxidative Stress].Mol Biol (Mosk). 2023 Nov-Dec;57(6):949-964. Mol Biol (Mosk). 2023. PMID: 38062952 Review. Russian.
-
Proteomics of rice in response to heat stress and advances in genetic engineering for heat tolerance in rice.Plant Cell Rep. 2011 Dec;30(12):2155-65. doi: 10.1007/s00299-011-1122-y. Epub 2011 Jul 17. Plant Cell Rep. 2011. PMID: 21769604 Review.
Cited by
-
Transcriptionally and post-transcriptionally regulated microRNAs in heat stress response in barley.J Exp Bot. 2014 Nov;65(20):6123-35. doi: 10.1093/jxb/eru353. Epub 2014 Sep 2. J Exp Bot. 2014. PMID: 25183744 Free PMC article.
-
ROS Regulation During Abiotic Stress Responses in Crop Plants.Front Plant Sci. 2015 Dec 8;6:1092. doi: 10.3389/fpls.2015.01092. eCollection 2015. Front Plant Sci. 2015. PMID: 26697045 Free PMC article. Review.
-
Rice Improvement Through Genome-Based Functional Analysis and Molecular Breeding in India.Rice (N Y). 2016 Dec;9(1):1. doi: 10.1186/s12284-015-0073-2. Epub 2016 Jan 7. Rice (N Y). 2016. PMID: 26743769 Free PMC article.
-
Mechanisms of metal resistance and homeostasis in haloarchaea.Archaea. 2013;2013:732864. doi: 10.1155/2013/732864. Epub 2013 Feb 21. Archaea. 2013. PMID: 23533331 Free PMC article. Review.
-
Whole-Transcriptome Profiling and Functional Prediction of Long Non-Coding RNAs Associated with Cold Tolerance in Japonica Rice Varieties.Int J Mol Sci. 2024 Feb 15;25(4):2310. doi: 10.3390/ijms25042310. Int J Mol Sci. 2024. PMID: 38396991 Free PMC article.
References
-
- Timperio AM, Egidi MG, Zolla L. Proteomics applied on plant abiotic stresses: role of heat shock proteins (HSP). J Proteomics. 2008;71:391–411. - PubMed
-
- Yoshida S, Satake T, Mackill DS. High temperature stress in rice. IRRI research paper series. No 67, International Rice Research Institute, Los Banos, Philippines. 1981. pp. 1–15.
-
- Slafer GA, Rawson HM. Sensitivity of wheat phasic development to major environmental factors: A re-examination of some assumptions by physiologists and modelers. Australian Journal of Plant Physiology. 1994;21:393–426.
-
- Satake T, Yoshida S. High temperature induced sterility in indica rices at flowering. Japanese Journal of Crop Sceince. 1978;47:6–17.
Publication types
MeSH terms
Substances
LinkOut - more resources
Full Text Sources

