. 2012;7(7):e40957.
doi: 10.1371/journal.pone.0040957. Epub 2012 Jul 16.

Increased autophagy in placentas of intrauterine growth-restricted pregnancies

Affiliations

Increased autophagy in placentas of intrauterine growth-restricted pregnancies

Tai-Ho Hung et al. PLoS One. 2012.

Abstract

Background: Unexplained intrauterine growth restriction (IUGR) may be a consequence of placental insufficiency; however, its etiology is not fully understood. We surmised that defective placentation in IUGR dysregulates cellular bioenergic homeostasis, leading to increased autophagy in the villous trophoblast. The aims of this work were (1) to compare the differences in autophagy, p53 expression, and apoptosis between placentas of women with normal or IUGR pregnancies; (2) to study the effects of hypoxia and the role of p53 in regulating trophoblast autophagy; and (3) to investigate the relationship between autophagy and apoptosis in hypoxic trophoblasts.

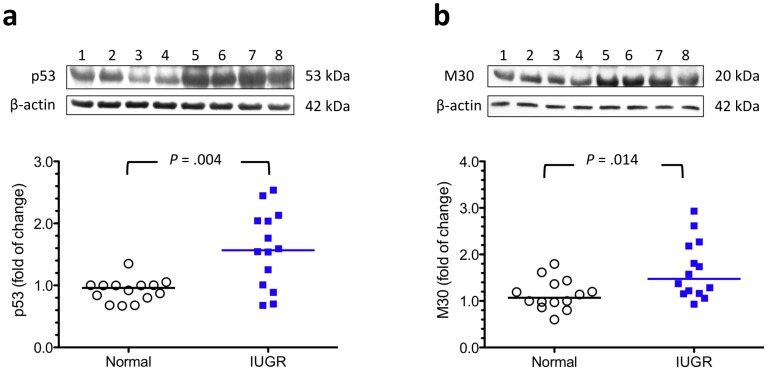
Methodology/principal findings: Compared with normal pregnant women, women with IUGR had higher placental levels of autophagy-related proteins LC3B-II, beclin-1, and damage-regulated autophagy modulator (DRAM), with increased p53 and caspase-cleaved cytokeratin 18 (M30). Furthermore, cytotrophoblasts cultured under hypoxia (2% oxygen) in the presence or absence of nutlin-3 (a p53 activity stimulator) had higher levels of LC3B-II, DRAM, and M30 proteins and increased Bax mRNA expression compared with controls cultured under standard conditions. In contrast, administration of pifithrin-α (a p53 activity inhibitor) during hypoxia resulted in protein levels that were similar to those of the control groups. Moreover, cytotrophoblasts transfected with LC3B, beclin-1, or DRAM siRNA had higher levels of M30 compared with the controls under hypoxia. However, transfection with Bcl-2 or Bax siRNA did not cause any significant change in the levels of LC3B-II in hypoxic cytotrophoblasts.

Conclusions/significance: Together, these results suggest that there is a crosstalk between autophagy and apoptosis in IUGR and that p53 plays a pivotal and complex role in regulating trophoblast cell turnover in response to hypoxic stress.


Conflict of interest statement

Competing Interests: The authors have declared that no competing interests exist.

Figures

Figure 1
Figure 1. Increased LC3B-II levels in the placentas from pregnancies complicated by IUGR and PE+IUGR.
(a–c) Formation of LC3B-punctae was noted in the trophoblasts and stromal cells of IUGR placentas. Scale bar  = 25 µm. (d) An antibody with a stronger reactivity to the type II form of LC3B showed significantly higher placental levels of LC3B-II in women with pregnancies complicated by IUGR (n = 14) and PE+IUGR (n = 15) compared with women with normal pregnancies (n = 14). There was no difference in the levels of placental LC3B-II between women with normal or PE pregnancies (n = 15). Lane 1, normal pregnancy; lane 2, IUGR pregnancy; lane 3, PE pregnancy; and lane 4, PE+IUGR pregnancy. (e, f) There was no difference in the expression of placental LC3B and LC3C mRNA between women with pregnancies complicated by IUGR (n = 14) and those with normal pregnancies (n = 14). Horizontal bars represent the median values. P values were based on the Kruskal-Wallis test followed by Dunn’s multiple comparison test (d) or the Mann-Whitney U-test (e, f) to compare differences between the groups. PE, preeclampsia; IUGR, idiopathic intrauterine growth restriction; N.S, non-significant.
Figure 2
Figure 2. Ultrastructural assessment of autophagic changes in the trophoblast layer of placentas from pregnancies complicated by IUGR and PE+IUGR.
Electron micrographs illustrating autophagic vacuoles in the trophoblast layer of the placenta from women with IUGR (a) and PE+IUGR (b, c). These autophagic vacuoles contain intracytoplasmic organelles, such as mitochondria (insets). In addition, loss of mitochondrial integrity (b) and dilatation of cis-ternae of rough endoplasmic reticulum (c) were noted in PE+IUGR placentas. Scale bar  = 1 µm and 500 nm in insets (a, c) and 250 nm and 500 nm in inset (b).
Figure 3
Figure 3. Increased beclin-1 levels in the placentas from pregnancies complicated by IUGR.
(a–e) Formation of beclin-1-punctae was noted in the trophoblast layer and some stromal cells in the villous tissues from women with IUGR. Scale bar  = 25 µm. (f, g) There was a significant increase in the placental levels of beclin-1 protein and mRNA in women with pregnancies complicated by IUGR (n = 14) compared with those with normal pregnancies (n = 14). Lanes 1–4, normal placental samples; lanes 5–8, IUGR placental samples. Horizontal bars represent the median values. P values were based on the Mann-Whitney U-test.
Figure 4
Figure 4. Increased p53 and M30 levels in the IUGR placentas.
Increased levels of p53 (a) and M30 (b), a cytokeratin 18 neoepitope produced downstream by caspase proteolytic action, were noted in the placentas from IUGR (n = 14) compared with those from normal pregnancies (n = 14). Lanes 1–4, normal placental samples; lanes 5–8, IUGR placental samples. Horizontal bars represent the median values. P values were based on the Mann-Whitney U-test.
Figure 5
Figure 5. Effects of hypoxia, nutlin-3, and pifithrin-α on changes in p53 level or activity in cultured cytotrophoblasts.
To verify the effects of hypoxia, nutlin-3, and pifithrin-α on changes in p53 level or activity, cytotrophoblasts were cultured under standard conditions, hypoxia (2% oxygen), or hypoxia with either nutlin-3 or pifithrin-α to regulate p53 activity. There was a significant increase in the expression of p53 mRNA (a) and protein (b–d) in cytotrophoblasts incubated under hypoxia with or without nutlin-3 compared with cells incubated under standard culture conditions. Hypoxia and nutlin-3 also led to an increase in p53 DNA-binding activity (e, f). In contrast, administering pifithrin-α under hypoxic conditions returned p53 mRNA and protein levels and p53 DNA-binding activity to those observed under standard conditions. (b) Representative immunoblots for cytosolic and nuclear p53 from cytotrophoblasts treated under different conditions are shown. β-actin and histone H1 were used to normalize for loading variability. (e) Representative gel shift analysis showing p53 DNA-binding activity under different experimental conditions. Horizontal bars represent the median values. P values were based on the Kruskal-Wallis test followed by Dunn’s multiple comparison test. A total of 10 individual experiments were performed.
Figure 6
Figure 6. Effects of hypoxia, nutlin-3, and pifithrin-α on changes in LC3B-II and M30 levels and Bax mRNA in cultured cytotrophoblasts.
To study the effect of hypoxia and the role of p53 in the regulation of autophagy and apoptosis, cytotrophoblasts were cultured under standard conditions, hypoxia (2% oxygen), or hypoxia with either nutlin-3 or pifithrin-α to regulate p53 activity. (a) Representative immunoblots for LC3B-II and M30 from cytotrophoblasts treated with different conditions are shown. β-actin was used to normalize for loading variability. (b) There was a significant increase in the levels of LC3B-II in cytotrophoblasts incubated under hypoxia with or without nutlin-3 compared with those incubated under standard culture conditions. These changes were associated with an increase in Bax mRNA (c) and M30 (d). In contrast, administration of pifithrin-α during hypoxia reduced LC3B-II, Bax mRNA, and M30 to levels similar to those observed under standard conditions. Horizontal bars represent the median values. P values were based on the Kruskal-Wallis test followed by Dunn’s multiple comparison test. At least 14 individual experiments were performed.
Figure 7
Figure 7. Bafilomycin A increased the level of LC3B-II in cytotrophoblasts under hypoxia.
Cytotrophoblasts were incubated under standard or hypoxic (2% oxygen) conditions with or without bafilomycin A1, an inhibitor that inhibits degradation of autophagosome content. Treatment with bafilomycin A1 increased LC3B-II, indicating that these cells had a high basal rate of autophagy under hypoxia. Horizontal bars represent the median values. P values were based on the Kruskal-Wallis test followed by Dunn’s multiple comparison test. A total of 10 individual experiments were performed.
Figure 8
Figure 8. Increased DRAM mRNA expression and protein in trophoblasts under hypoxia and in IUGR placentas.
(a, b) Hypoxia increased DRAM mRNA and protein levels in cytotrophoblasts. The levels of DRAM mRNA and protein increased further with administration of nutlin-3, while incubation with pifithrin-α reduced the changes. Horizontal bars represent the median values. P values were based on the Kruskal-Wallis test followed by Dunn’s multiple comparison test. A total of 12 individual experiments were performed. (c, d) In parallel, there were significantly higher levels of DRAM mRNA and protein in villous samples from women with IUGR (n = 14) compared with those from normal pregnant women (n = 14). Horizontal bars represent the median values. P values were based on the Mann-Whitney U-test. (e–g) Immunofluorescent labeling for DRAM (green) and cytokeratin 7 (red) in placental samples from a woman with a normal term pregnancy and two women with pregnancies complicated by IUGR. Note that DRAM was mainly localized at stromal cells and, to a lesser extent, the cytotrophoblasts. Compared with placentas of normal pregnancy, there were more DRAM immunofluoresence-positive cells in the villous tissues of IUGR. The sections were stained with DAPI (blue) to highlight all nuclei. Scale bar  = 50 µm.
Figure 9
Figure 9. Effects of reducing the transcription of LC3B, beclin-1 and DRAM on the levels of M30 in cytotrophoblasts under hypoxia.
To study the relationship between autophagy and apoptosis in cytotrophoblasts under hypoxia, the cells were transfected with LC3B, beclin-1 and DRAM-specific siRNA, and the levels of M30 were measured after 48 hours of incubation at 2% oxygen. (a, d, e) Representative immunoblots for LC3B-II, beclin-1, and DRAM from cytotrophoblasts transfected with or without specific siRNA are shown. β-actin was used to normalize for loading variability. (b, e, h) Compared with the control groups, cytotrophoblasts transfected with specific siRNAs had a 40–45% reduction in the levels of corresponding protein. (c, f, i) Compared with the control groups, cytotrophoblasts transfected with LC3B, beclin-1 or DRAM siRNA had higher levels of M30. Horizontal bars represent the median values. P values were based on the Mann-Whitney U-test. For each siRNA study, 10 individual experiments were performed.
Figure 10
Figure 10. Effects of reducing the transcription of Bcl-2 and Bax on the levels of M30 and LC3B-II in cytotrophoblasts under hypoxia.
To study the relationship between autophagy and apoptosis in cytotrophoblasts under hypoxia, the cells were transfected with Bcl-2- and Bax-specific siRNA, and the levels of M30 and LC3B-II were measured after 48 hours of incubation at 2% oxygen. (a) Representative immunoblots for Bcl-2, M30, and LC3B-II from cytotrophoblasts transfected with or without Bcl-2 siRNA are shown. Compared with the control groups, cytotrophoblasts transfected with Bcl-2 siRNA had a nearly 50% reduction in the levels of Bcl-2 protein (b) but a higher level of M30 (c). There was no difference in the levels of LC3B-II between the two groups (d). (e) Representative immunoblots for Bax, M30, and LC3B-II from cytotrophoblasts transfected with or without Bax siRNA are shown. Compared with the control groups, cytotrophoblasts transfected with Bax siRNA had significantly lower levels of Bax (f) and M30 (g) under hypoxia. There was no difference in the levels of LC3B-II between the two groups (h). β-actin was used to normalize for loading variability. Horizontal bars represent the median values. P values were based on the Mann-Whitney U-test. For each siRNA study, 10 individual experiments were performed.

References

    1. Klionsky DJ, Emr SD. Autophagy as a regulated pathway of cellular degradation. Science. 2000;290:1717–1721. - PMC - PubMed
    1. Maiuri MC, Zalckvar E, Kimchi A, Kroemer G. Self-eating and self-killing: crosstalk between autophagy and apoptosis. Nat Rev Mol Cell Biol. 2007;8:741–752. - PubMed
    1. Levine B, Klionsky DJ. Development by self-digestion: molecular mechanisms and biological functions of autophagy. DevCell. 2004;6:463–477. - PubMed
    1. Brosens JJ, Pijnenborg R, Brosens IA. The myometrial junctional zone spiral arteries in normal and abnormal pregnancies: a review of the literature. Am J Obstet Gynecol. 2002;187:1416–1423. - PubMed
    1. Mayhew TM. A stereological perspective on placental morphology in normal and complicated pregnancies. J Anat. 2009;215:77–90. - PMC - PubMed

Publication types

Substances