. 2012;7(7):e41147.
doi: 10.1371/journal.pone.0041147. Epub 2012 Jul 18.

Hydrogen sulfide inhibits the development of atherosclerosis with suppressing CX3CR1 and CX3CL1 expression

Affiliations

Hydrogen sulfide inhibits the development of atherosclerosis with suppressing CX3CR1 and CX3CL1 expression

Huili Zhang et al. PLoS One. 2012.

Abstract

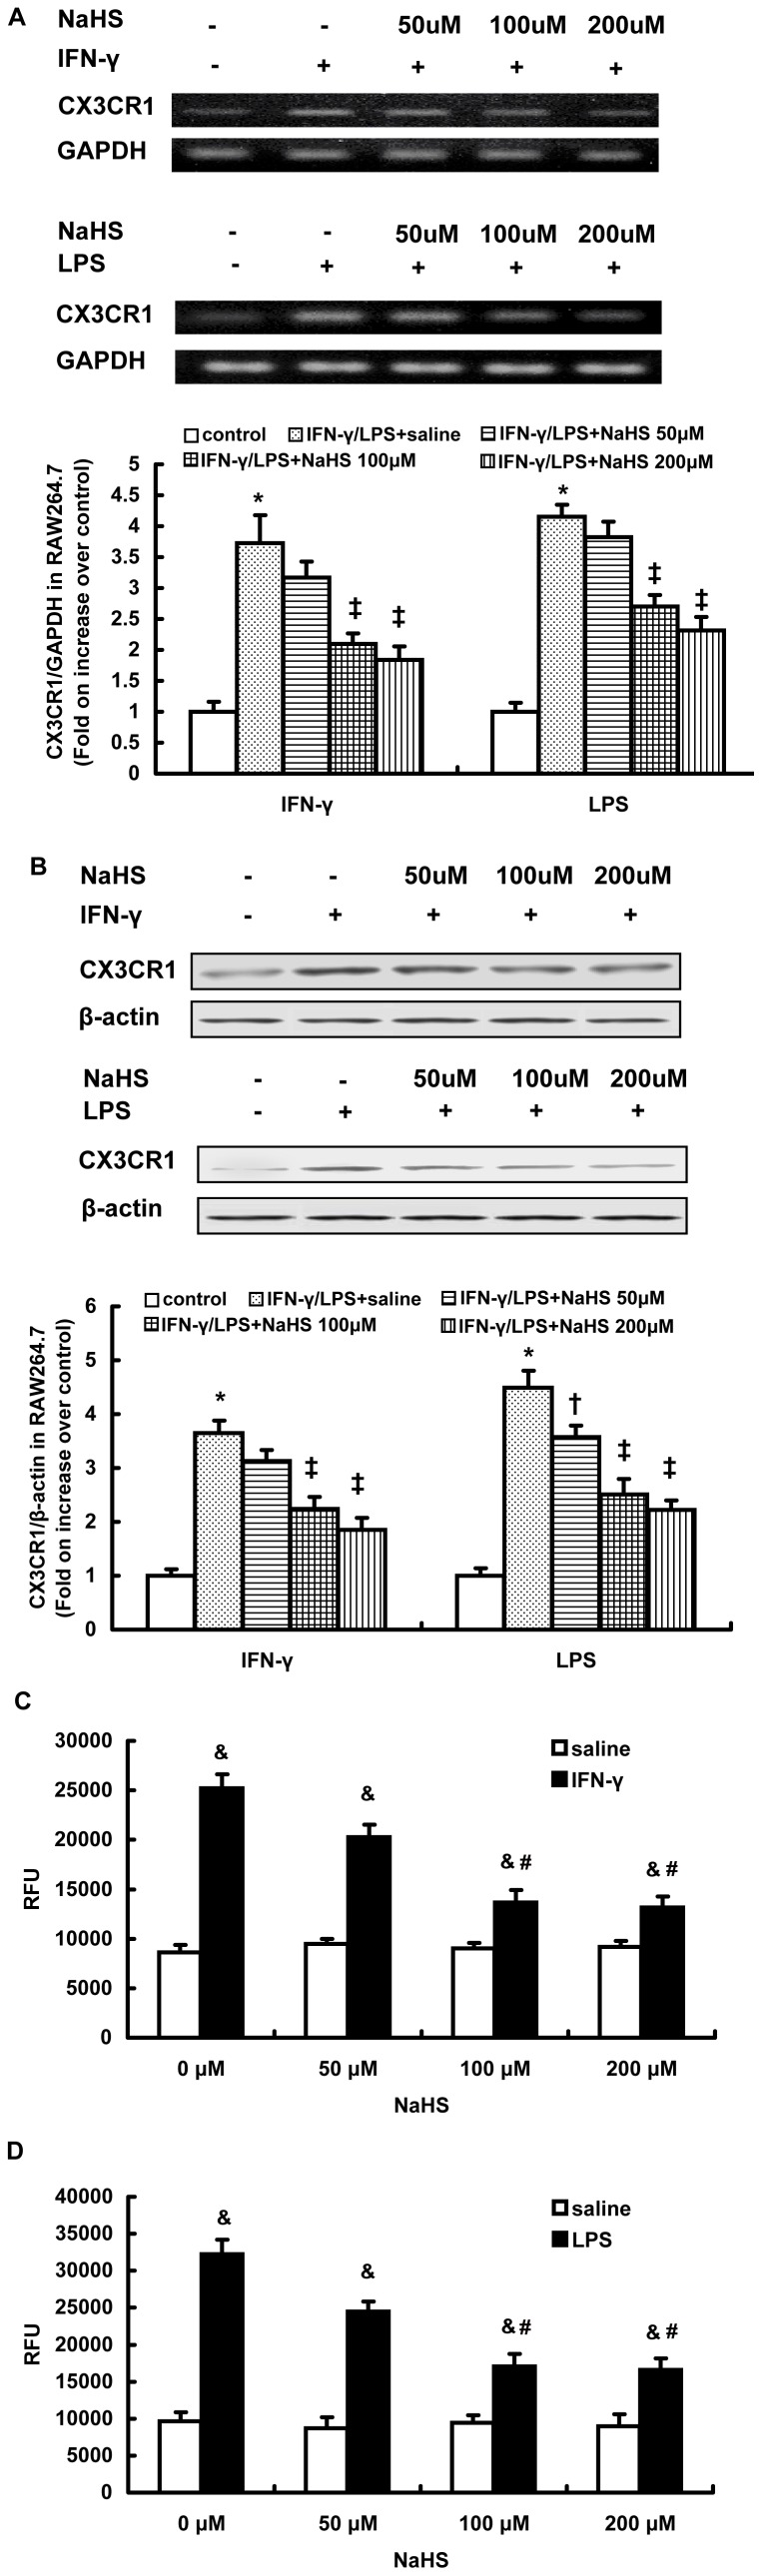
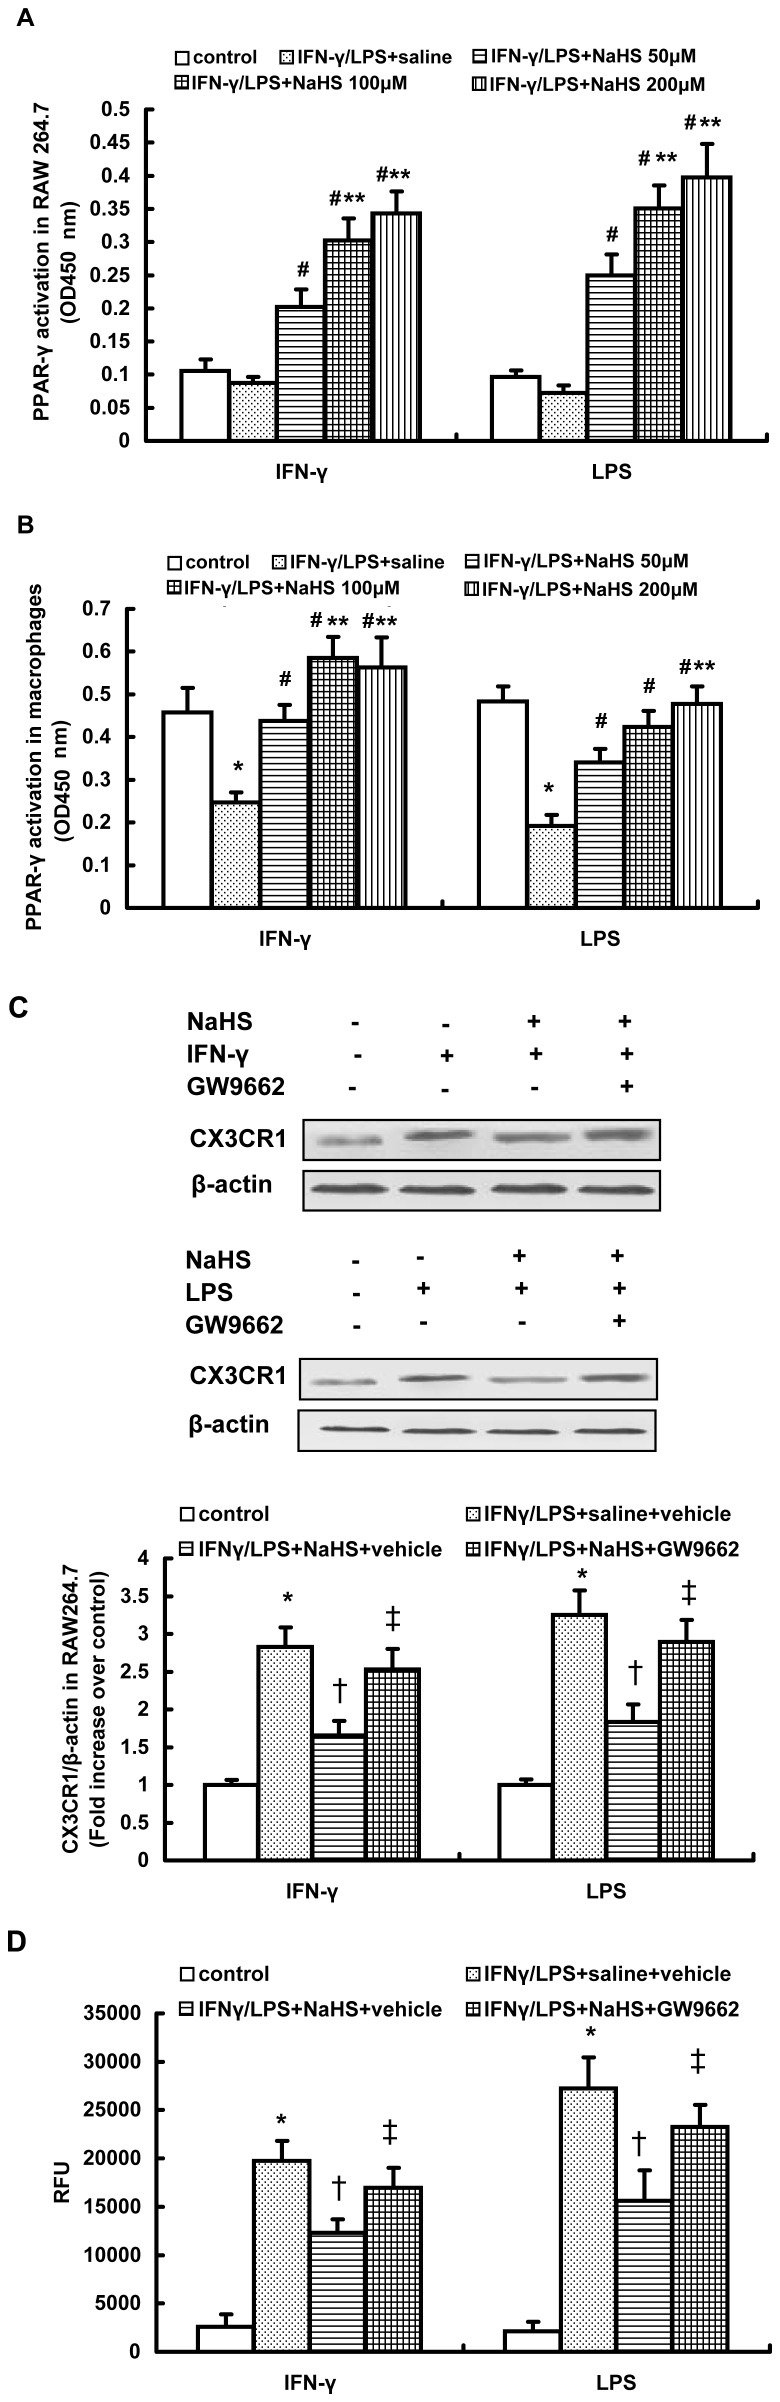
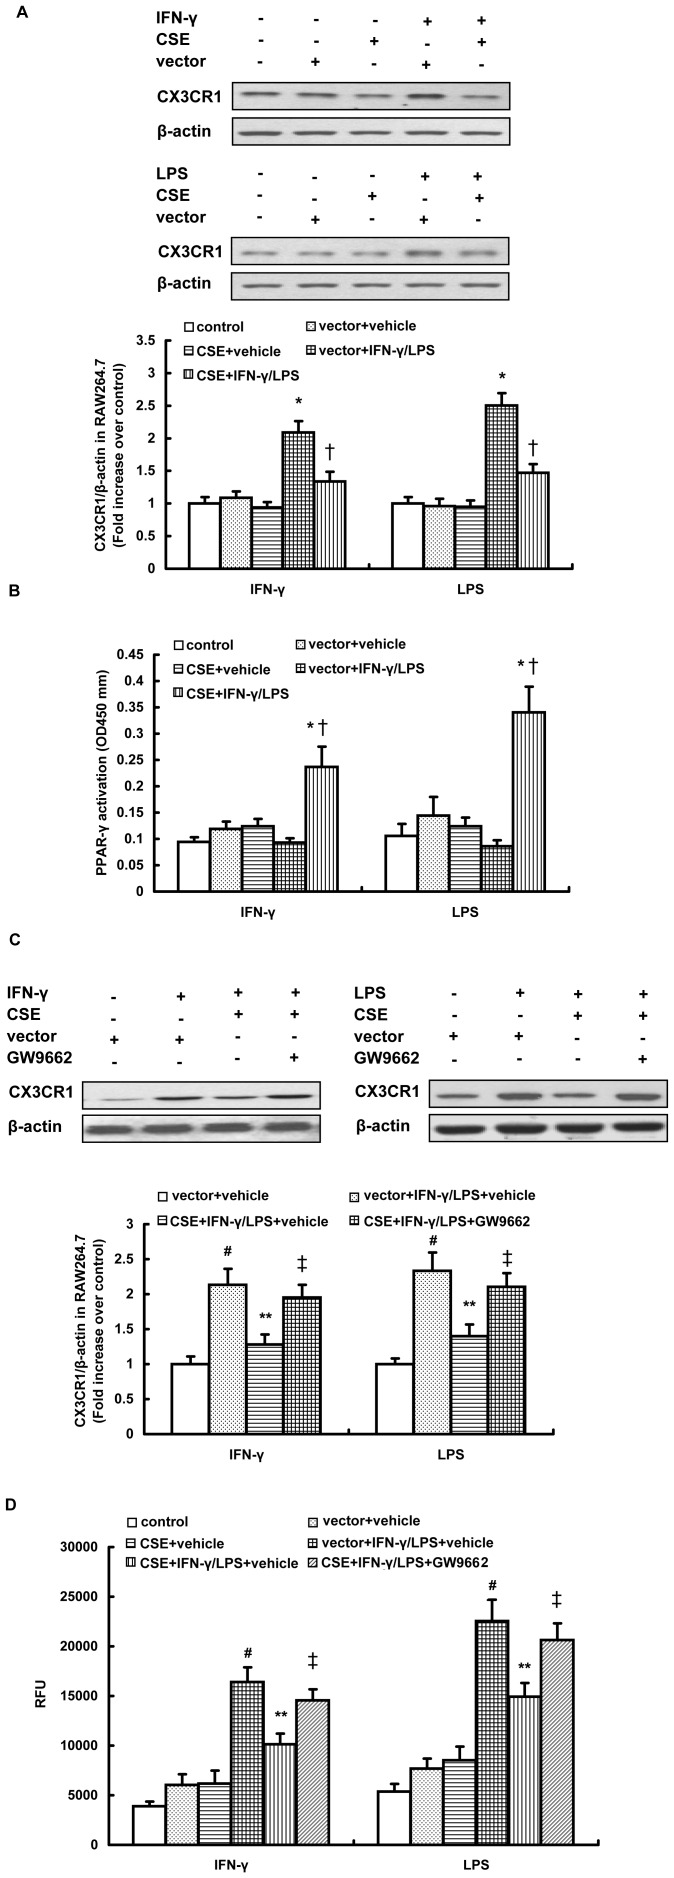
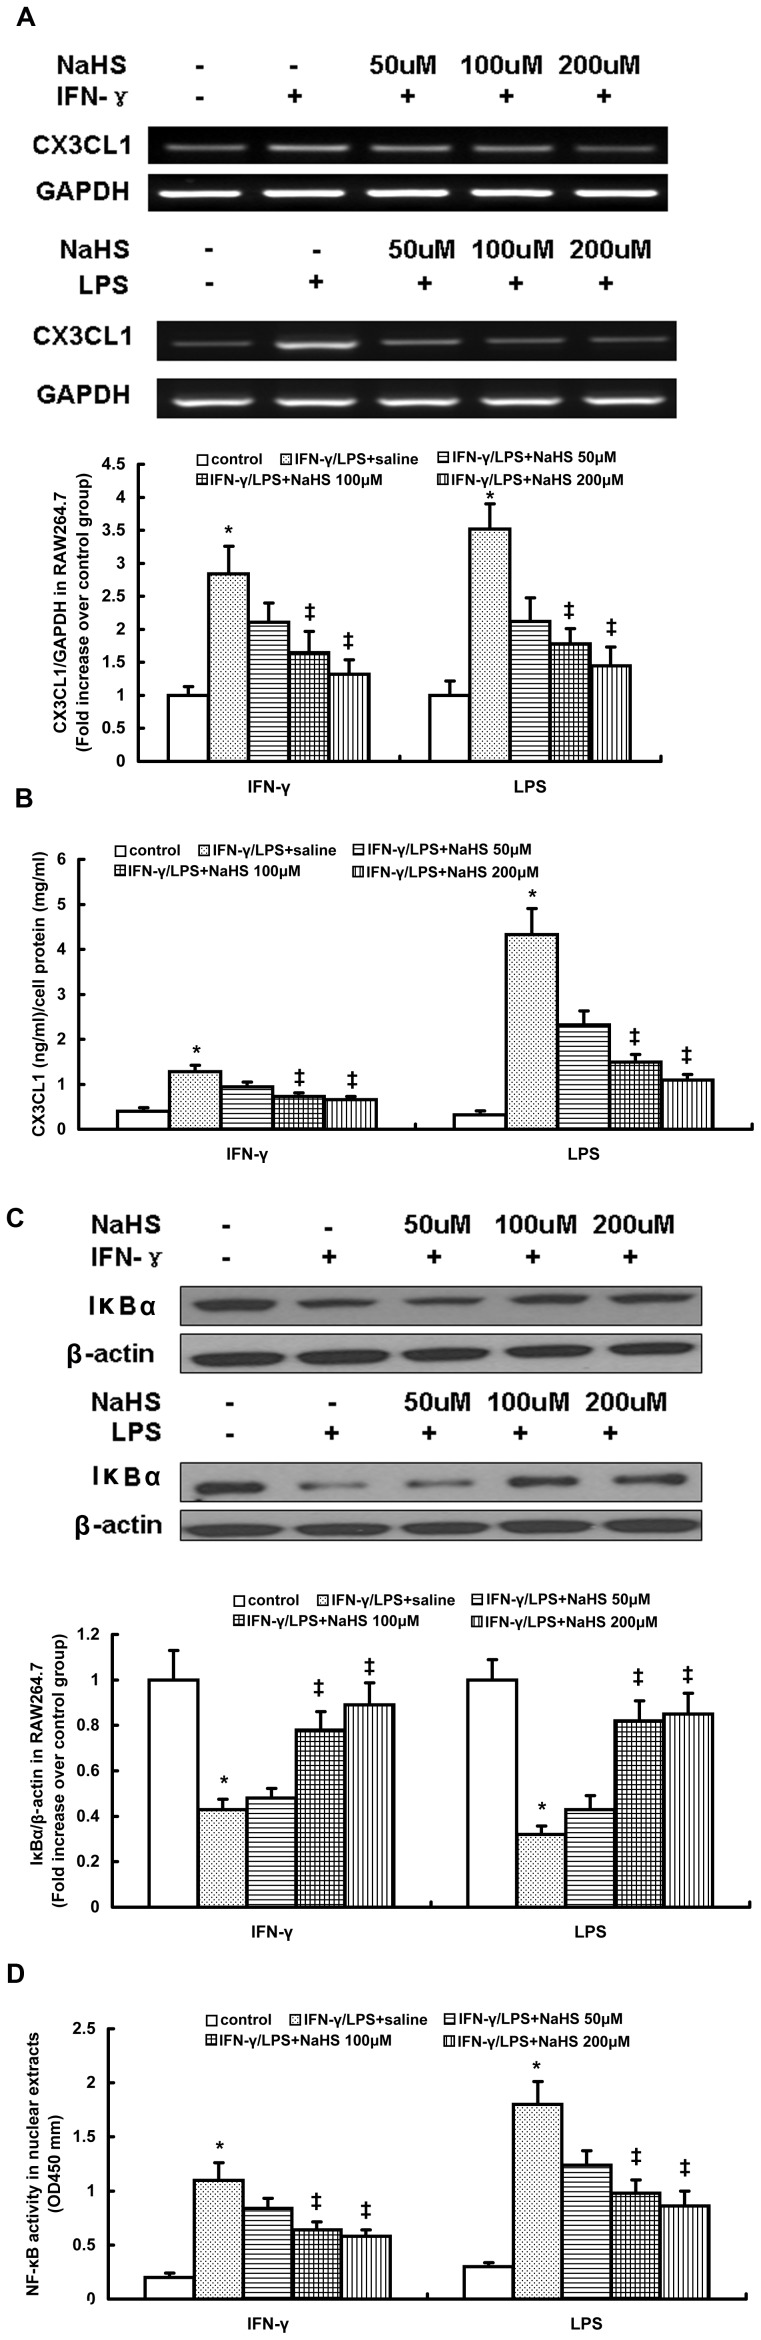
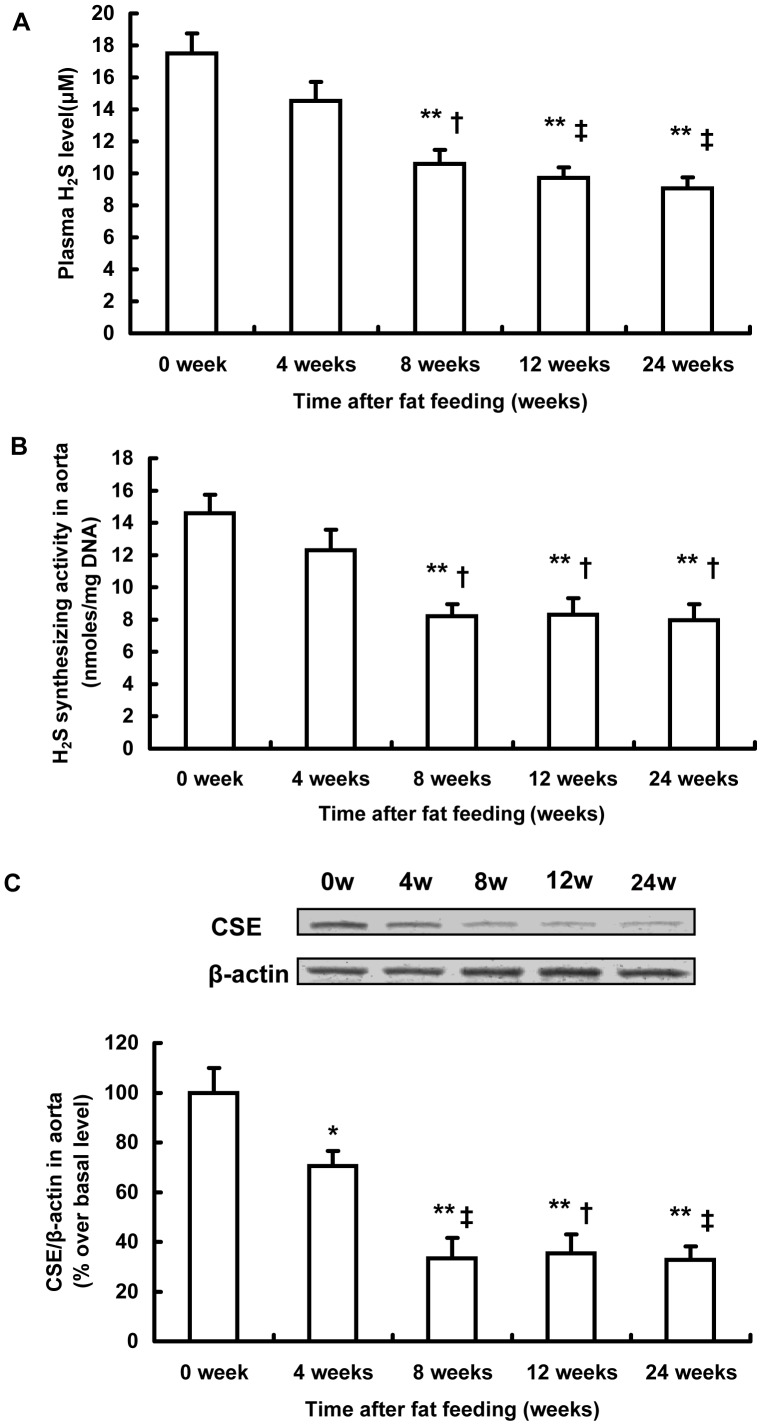
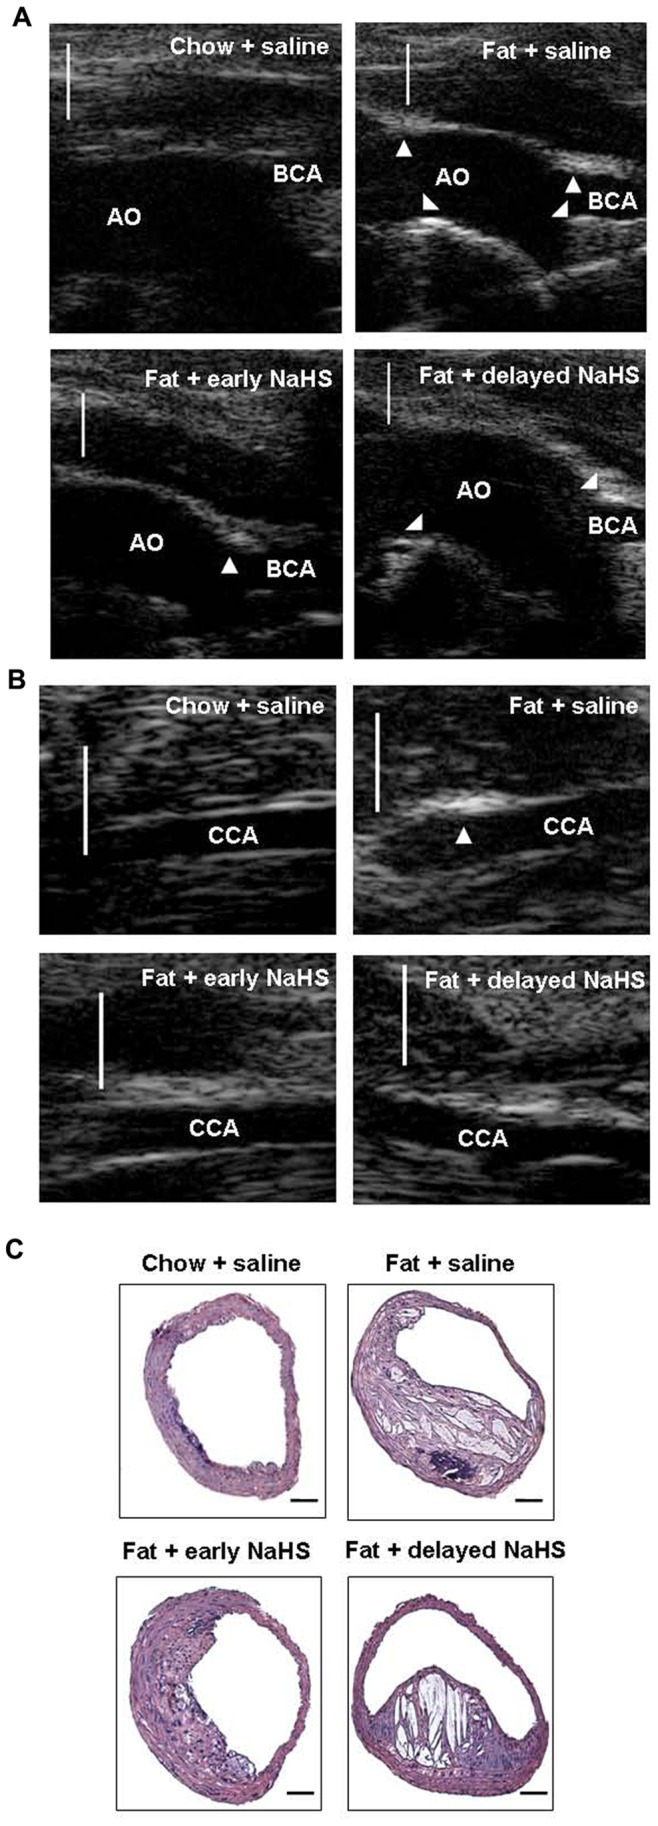
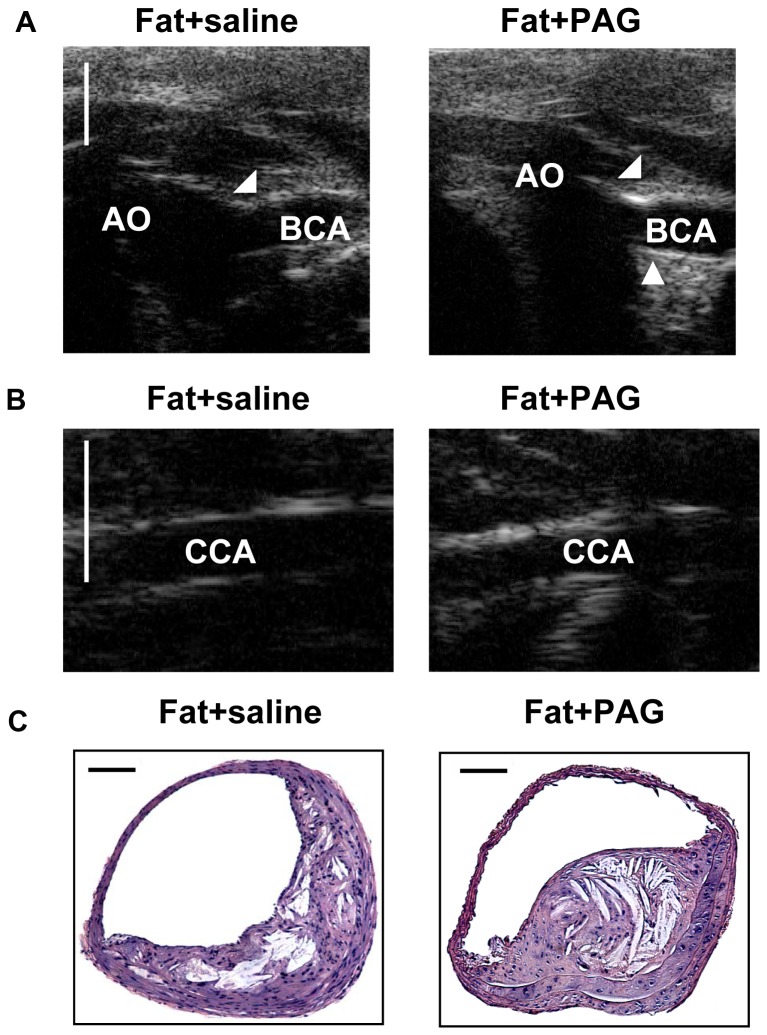
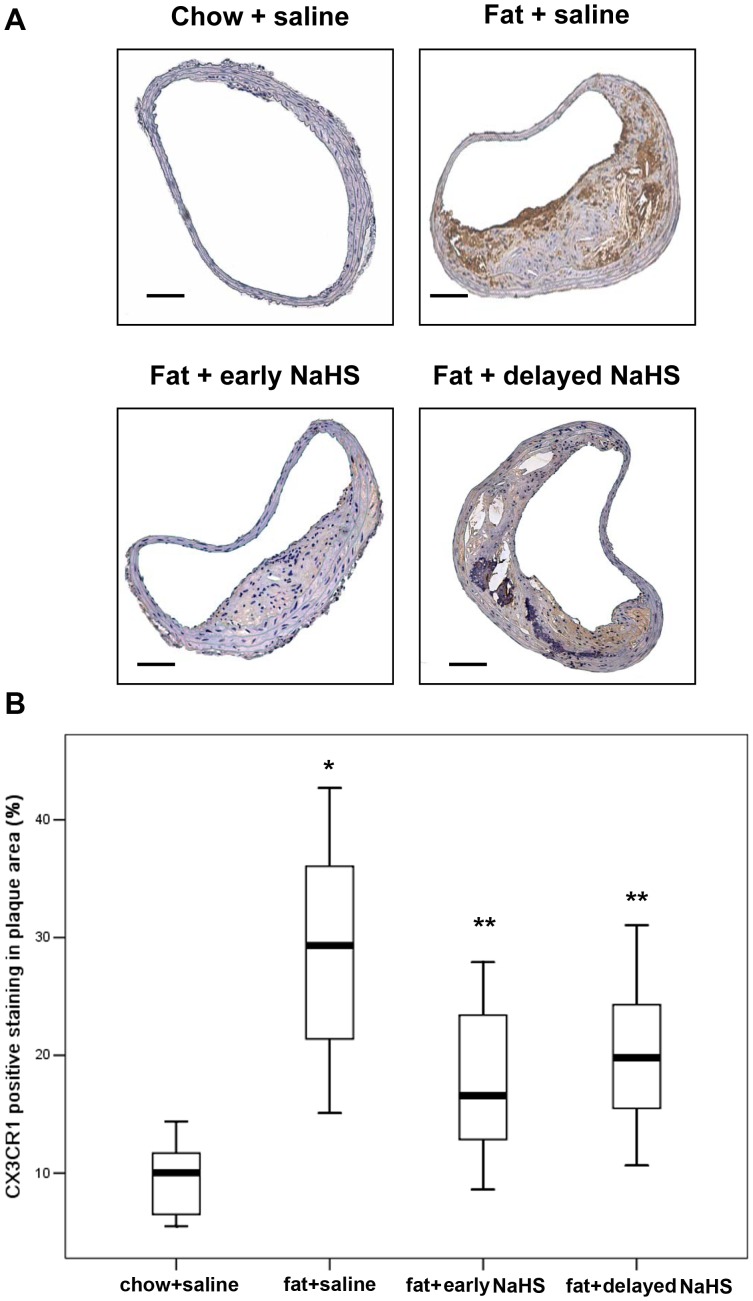
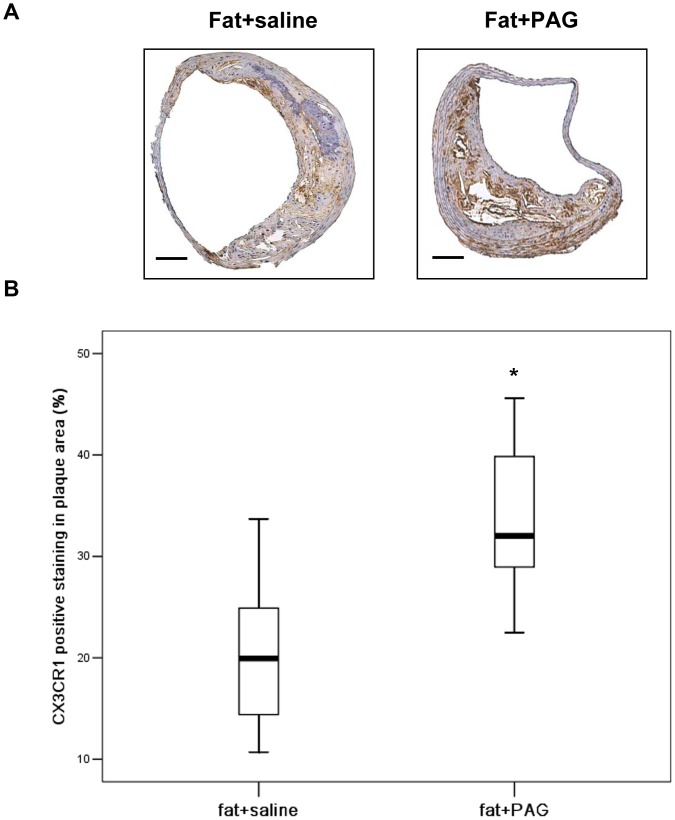
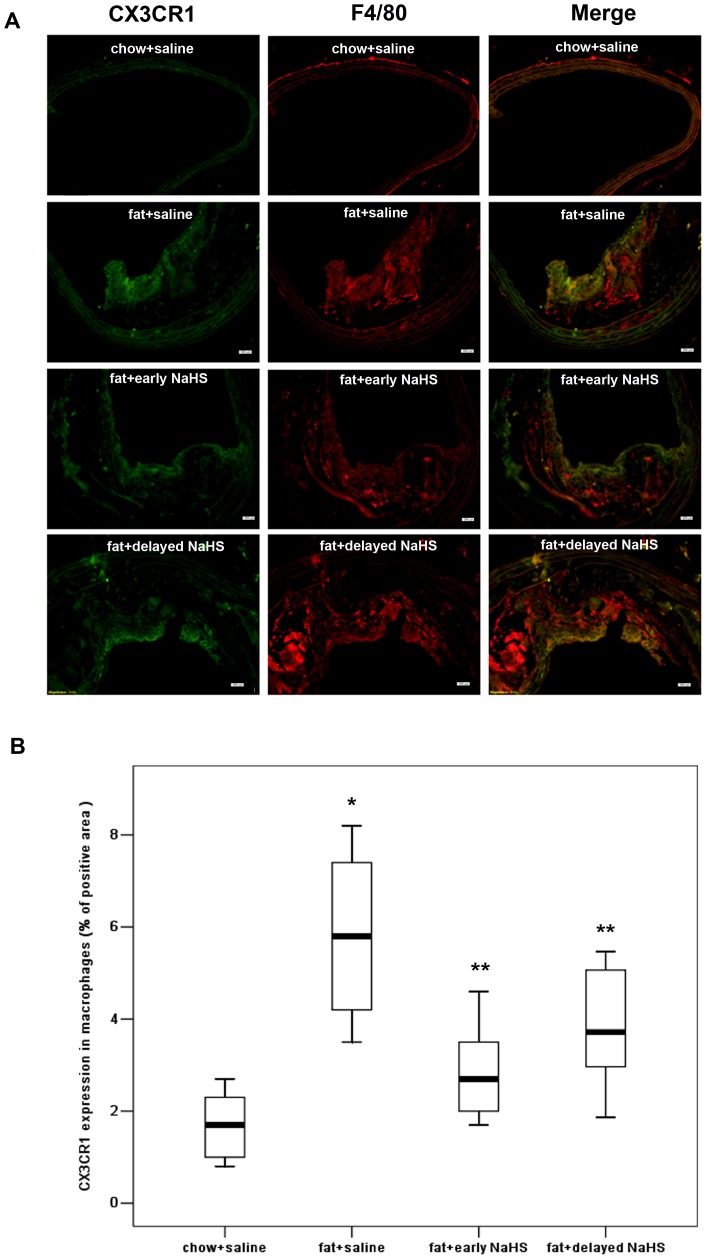
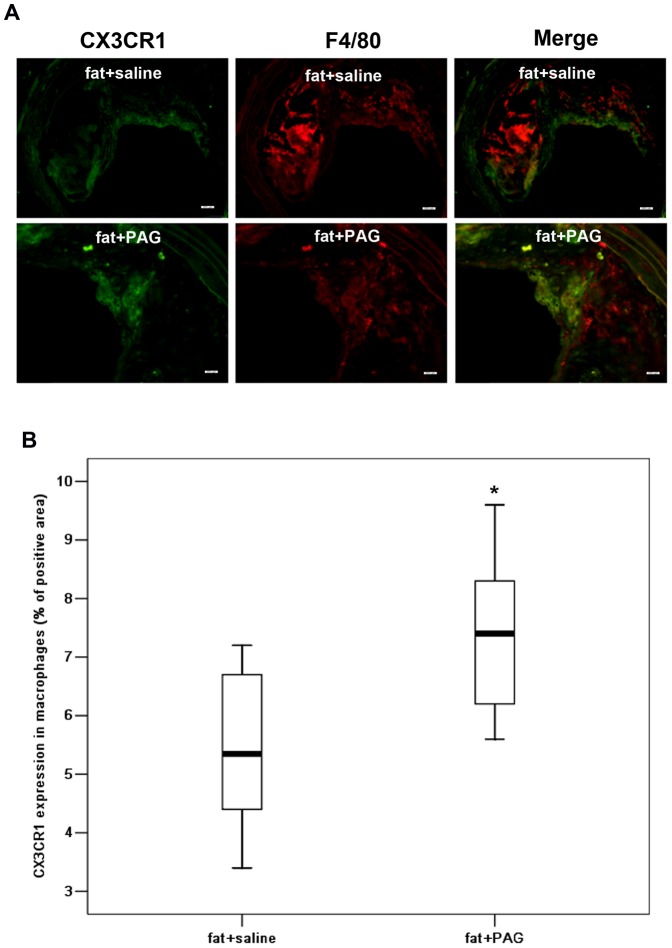
Hydrogen sulfide, as a novel gaseous mediator, has been suggested to play a key role in atherogenesis. However, the precise mechanisms by which H(2)S affects atherosclerosis remain unclear. Therefore, the present study aimed to investigate the potential role of H(2)S in atherosclerosis and the underlying mechanism with respect to chemokines (CCL2, CCL5 and CX3CL1) and chemokine receptors (CCR2, CCR5, and CX3CR1) in macrophages. Mouse macrophage cell line RAW 264.7 or mouse peritoneal macrophages were pre-incubated with saline or NaHS (50 µM, 100 µM, 200 µM), an H(2)S donor, and then stimulated with interferon-γ (IFN-γ) or lipopolysaccharide (LPS). It was found that NaHS dose-dependently inhibited IFN-γ or LPS-induced CX3CR1 and CX3CL1 expression, as well as CX3CR1-mediated chemotaxis in macrophages. Overexpression of cystathionine γ-lyase (CSE), an enzyme that catalyzes H(2)S biosynthesis resulted in a significant reduction in CX3CR1 and CX3CL1 expression as well as CX3CR1-mediated chemotaxis in stimulated macrophages. The inhibitory effect of H(2)S on CX3CR1 and CX3CL1 expression was mediated by modulation of proliferators-activated receptor-γ (PPAR-γ) and NF-κB pathway. Furthermore, male apoE(-/-) mice were fed a high-fat diet and then randomly given NaHS (1 mg/kg, i.p., daily) or DL-propargylglycine (PAG, 10 mg/kg, i.p., daily). NaHS significantly inhibited aortic CX3CR1 and CX3CL1 expression and impeded aortic plaque development. NaHS had a better anti-atherogenic benefit when it was applied at the early stage of atherosclerosis. However, inhibition of H(2)S formation by PAG increased aortic CX3CR1 and CX3CL1 expression and exacerbated the extent of atherosclerosis. In addition, H(2)S had minimal effect on the expression of CCL2, CCL5, CCR2 and CCR5 in vitro and in vivo. In conclusion, these data indicate that H(2)S hampers the progression of atherosclerosis in fat-fed apoE(-/-) mice and downregulates CX3CR1 and CX3CL1 expression on macrophages and in lesion plaques.


Conflict of interest statement

Competing Interests: The authors have declared that no competing interests exist.

Figures

Figure 1
Figure 1. Effect of NaHS on CX3CR1 expression and CX3CR1-mediated chemotaxis in RAW264.7 cells stimulated with IFN-γ or LPS. RT-PCR analysis for CX3CR1 mRNA (A), western blot analysis for CX3CR1 protein expression (B) and chemotaxis towards CX3CL1 (50 ng/ml) (C, D) were carried out as described in Materials and Methods.
The data are means ± SEM of at least three independent experiments. *P<0.05, compared with unstimulated cells (control). ‡P<0.05, compared with stimulated cell pretreated with NaHS (50 µM). & P<0.05, compared with unstimulated cells pretreated with NaHS at the same concentration. #P<0.05, compared with stimulated cells pretreated with NaHS at a concentration of 50 µM.
Figure 2
Figure 2. Effect of NaHS on PPAR-γ activation in IFN-γ or LPS-stimulated macrophages.
(A, B) RAW264.7 cells (A) or mouse peritoneal macrophages (B) were pre-incubated with saline or NaHS (50 µM, 100 µM, 200 µM) for 6 hours and then stimulated with IFN-γ or LPS for 12 hours in the continuous presence of NaHS or saline. The DNA binding activity of PPAR-γ in nuclear extracts was carried out as described in Materials and Methods. (C, D) RAW264.7 cells were incubated with GW9662 (10 µM) or vehicle for 1 hour, further incubated with NaHS (100 µM) or saline for 6 hours and then stimulated with IFN-γ or LPS for 12 hours in the continuous presence of NaHS or saline. Western blot analysis for CX3CR1 expression (C) and chemotaxis towards CX3CL1 (50 ng/ml) (D) were assayed as described in Materials and Methods. The data are means ± SEM of at least three independent experiments. *P<0.05, compared with unstimulated cells (control). #P<0.05, compared with stimulated cells pretreated with saline. **P<0.05, compared with stimulated cell pretreated with NaHS (50 µM). †P<0.05, compared with stimulated cells treated with saline and vehicle. ‡P<0.05, compared with stimulated cell treated with NaHS and vehicle.
Figure 3
Figure 3. Effect of CSE overexpression on CX3CR1 expression and PPAR-γ activation in stimulated RAW264.7 cells.
Cells were transfected with CSE cDNA construct or empty vector and then were stimulated with IFN-γ (500 U/ml) or LPS (10 µg/ml) for 12 hours. Some transfected cells were pre-incubated with GW9962 (10 µM) for 1 hour before addition of IFN-γ or LPS. Western blot analysis for CX3CR1 expression (A, C), PPAR-γ activation (B) and CX3CR1-mediated chemotaxis towards CX3CL1 (50 ng/ml) (D) were assayed as described in Materials and methods. The data are means ± SEM of at least three independent experiments. *P<0.05, compared with unstimulated cells transfected with CSE construct or empty vector. †P<0.05, compared with stimulated cells transfected with empty vector. #P<0.05, compared with mock-transfected and unstimulated cells treated with vehicle. **P<0.05, compared with mock-transfected and stimulated cells treated with vehicle. ‡P<0.05, compared with CSE-transfected and stimulated cells treated with vehicle.
Figure 4
Figure 4. Effect of NaHS on CX3CL1 expression, IκBα content and p65 DNA binding activity in RAW264.7 cells stimulated with IFN-γ or LPS.
RT-PCR analysis for CX3CL1 mRNA (A), ELISA for lysate CX3CL1 protein level (B), western blot analysis for IκBα content (C) and ELISA for p65 DNA binding activity in nuclear extracts (D) were carried out as described in Materials and Methods. The data are means ± SEM of at least three independent experiments. *P<0.05, compared with unstimulated cells (control). ‡P<0.05, compared with stimulated cell pretreated with saline.
Figure 5
Figure 5. Alterations in H2S biosynthesis during the development of atherosclerosis in fat-fed apoE−/− mice.
Plasma H2S level (A), H2S synthesizing activity (B) and CSE expression in aorta (C) were assayed at indicated time points (0, 4, 8, 12, 24 weeks after fat feeding). Results shown are the mean ± SEM (n = 6 animals in each group). *P<0.05, compared with the basal level at 0 weeks. **P<0.01, compared with the basal level at 0 weeks. †P<0.05, compared with mice sacrificed 4 weeks after fat feeding. ‡P<0.01, compared with mice sacrificed 4 weeks after fat feeding.
Figure 6
Figure 6. Effect of NaHS on the development of atherosclerosis in fat-fed apoE−/− mice.
(A) Representative UBM images were taken from the aortic arch (AO) and BCA in mice with chow and saline, mice with fat feeding and saline, mice with fat feeding and early NaHS treatment or mice with fat feeding and delayed NaHS treatment. (B) Representative UBM images were taken from CCA in mice with chow and saline, mice with fat feeding and saline, mice with fat feeding and early NaHS treatment or mice with fat feeding and delayed NaHS treatment. Scale bar for UBM  =  1 mm. Atherosclerotic plaques are identified by arrows. (C) Representative H&E staining images were taken from BCA in mice with chow and saline, mice with fat feeding and saline, mice with fat feeding and early NaHS treatment or mice with fat feeding and delayed NaHS treatment. Scale bar for histological images  =  100 µm.
Figure 7
Figure 7. Effect of PAG on the development of atherosclerosis in fat-fed apoE−/− mice.
(A) Representative UBM images were taken from the aortic arch (AO) and BCA in mice with fat feeding and saline, mice with fat feeding and PAG treatment. (B) Representative UBM images were taken from CCA in mice with fat feeding and saline, mice with fat feeding and PAG treatment. Scale bar for UBM  =  1 mm. Atherosclerotic plaques are identified by arrows. (C) Representative H&E staining images were taken from BCA in mice with fat feeding and saline, mice with fat feeding and PAG treatment. Scale bar for histological images  =  100 µm.
Figure 8
Figure 8. Effect of NaHS on the expression of CX3CR1 in atherosclerotic plaques in fat-fed apoE−/− mice.
(A) Representative immunohistochemical images were taken from BCA in mice with chow and saline, mice with fat feeding and saline, mice with fat feeding and early NaHS treatment or mice with fat feeding and delayed NaHS treatment. Scale bar for histological images  =  100 µm. (B) BCA sections from mice with chow and saline, mice with fat feeding and saline, mice with fat feeding and early NaHS treatment or mice with fat feeding and delayed NaHS treatment, were quantified immunohistochemically for CX3CR1 positive staining. Results shown are the mean ± SEM (n = 6–8 animals in each group). *P<0.05, compared with mice with chow and saline; **P<0.05, compared with mice with fat feeding and saline.
Figure 9
Figure 9. Effect of PAG on the expression of CX3CR1 in atherosclerotic plaques in fat-fed apoE−/− mice.
(A) Representative immunohistochemical images were taken from BCA in mice with fat feeding and saline, mice with fat feeding and PAG treatment. Scale bar for histological images  =  100 µm. (B) BCA sections from mice with fat feeding and saline and mice with fat feeding and PAG treatment were quantified immunohistochemically for CX3CR1 positive staining. Results shown are the mean ± SEM (n = 6–8 animals in each group). *P<0.05, compared with mice with fat feeding and saline.
Figure 10
Figure 10. Effect of NaHS on the expression of CX3CR1 in macrophages in atherosclerotic plaques.
(A) Representative immunofluorescent stainging images for CX3CR1 and F4/80 colocalization were taken from BCA in mice with chow and saline, mice with fat feeding and saline, mice with fat feeding and early NaHS treatment or mice with fat feeding and delayed NaHS treatment. Scale bar for histological images  =  20 µm. (B) BCA sections from mice with chow and saline, mice with fat feeding and saline, mice with fat feeding and early NaHS treatment or mice with fat feeding and delayed NaHS treatment, were quantified immunohistochemically for CX3CR1 positive staining. Results shown are the mean ± SEM (n = 6–8 animals in each group). *P<0.05, compared with mice with chow and saline; **P<0.05, compared with mice with fat feeding and saline.
Figure 11
Figure 11. Effect of PAG on the expression of CX3CR1 in macrophage in atherosclerotic plaques.
(A) Representative immunofluorescent staining images for CX3CR1 and F4/80 colocalization were taken from BCA in mice with fat feeding and saline, mice with fat feeding and PAG treatment. Scale bar for histological images  =  20 µm. (B) BCA sections from mice with fat feeding and saline and mice with fat feeding and PAG treatment, were quantified immunohistochemically for CX3CR1 positive staining. Results shown are the mean ± SEM (n = 6–8 animals in each group). *P<0.05, compared with mice with fat feeding and saline.

Similar articles

Cited by

References

    1. Renga B. Hydrogen sulfide generation in mammals: the molecular biology of cystathionine-β-synthase (CBS) and cystathionine-γ-lyase (CSE). Inflamm Allergy Drug Targets. 2011;10:85–91. - PubMed
    1. Lefer DJ. A new gaseous signaling molecule emerges: cardioprotective role of hydrogen sulfide. Proc Natl Acad Sci. 2007;104:17907–17908. - PMC - PubMed
    1. Elsey DJ, Fowkes RC, Baxter GF. Regulation of cardiovascular cell function by hydrogen sulfide (H2S). Cell Biochem Funct. 2010;28:95–106. - PubMed
    1. Wang Y, Zhao X, Jin H, Wei H, Li W, et al. Role of hydrogen sulfide in the development of atherosclerotic lesions in apolipoprotein E knockout mice. Arterioscler Thromb Vasc Biol. 2009;29:173–179. - PubMed
    1. Zhao ZZ, Wang Z, Li GH, WanG R, Tan JM, et al. Hydrogen sulfide inhibits macrophage-derived foam cell formation. Exp Biol Med (Maywood) 2011;236:169–176. - PubMed

Publication types

MeSH terms