. 2012;7(7):e41169.
doi: 10.1371/journal.pone.0041169. Epub 2012 Jul 17.

Global transcriptome analysis in influenza-infected mouse lungs reveals the kinetics of innate and adaptive host immune responses

Affiliations

Global transcriptome analysis in influenza-infected mouse lungs reveals the kinetics of innate and adaptive host immune responses

Claudia Pommerenke et al. PLoS One. 2012.

Abstract

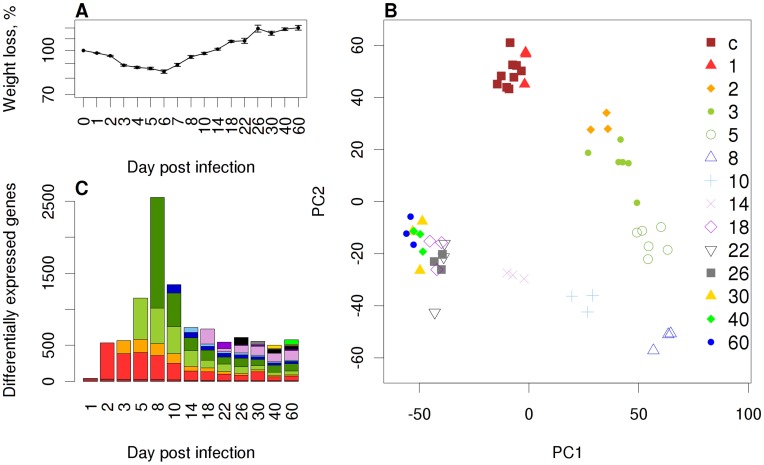
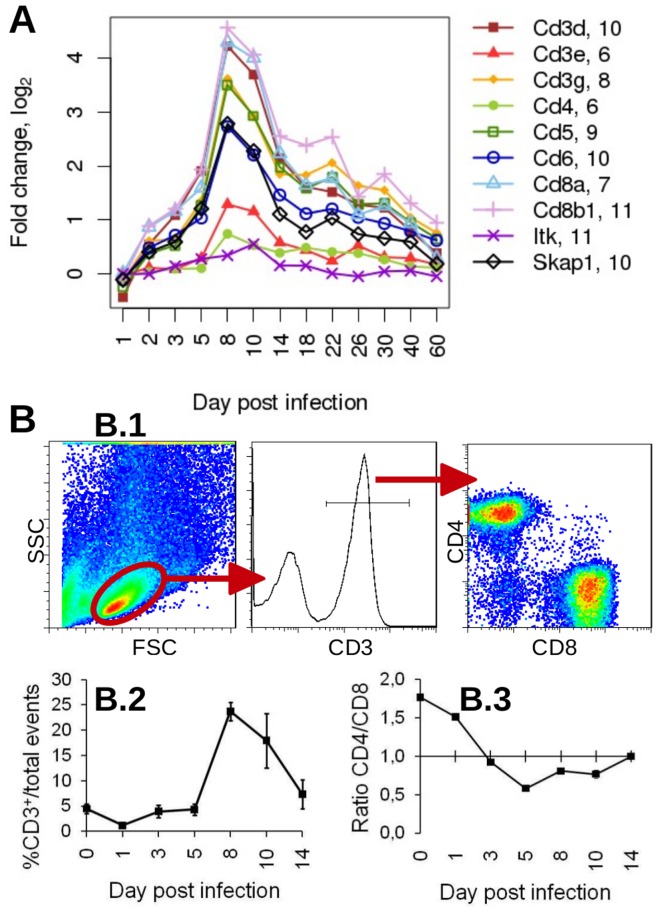
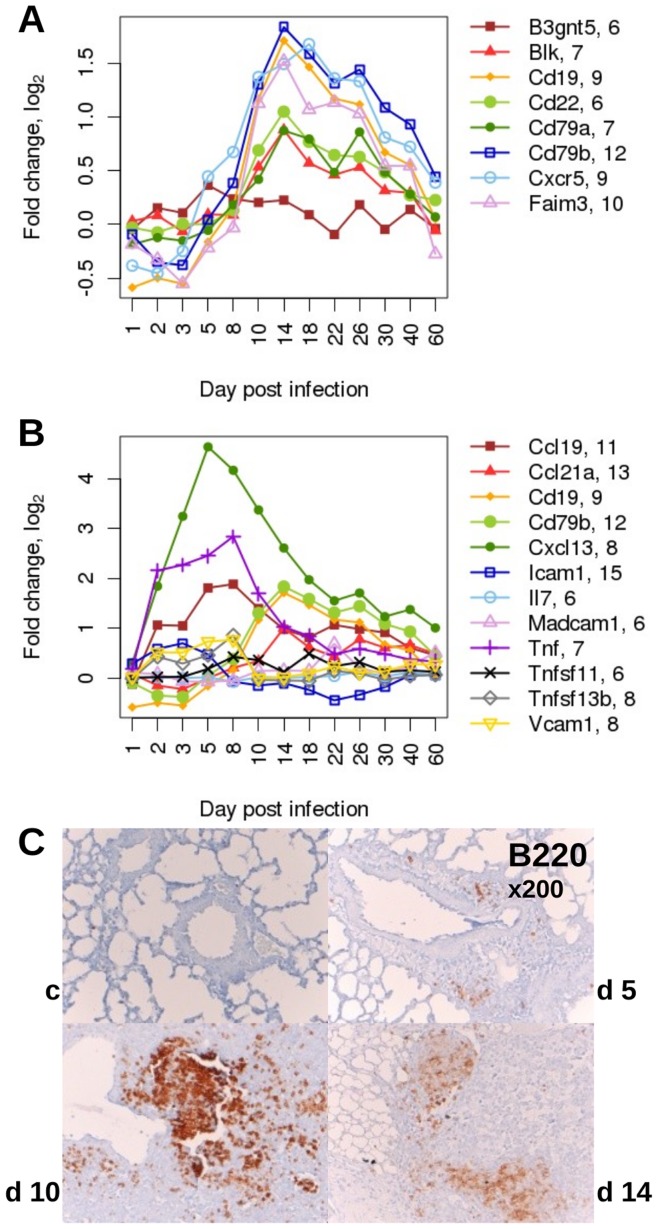
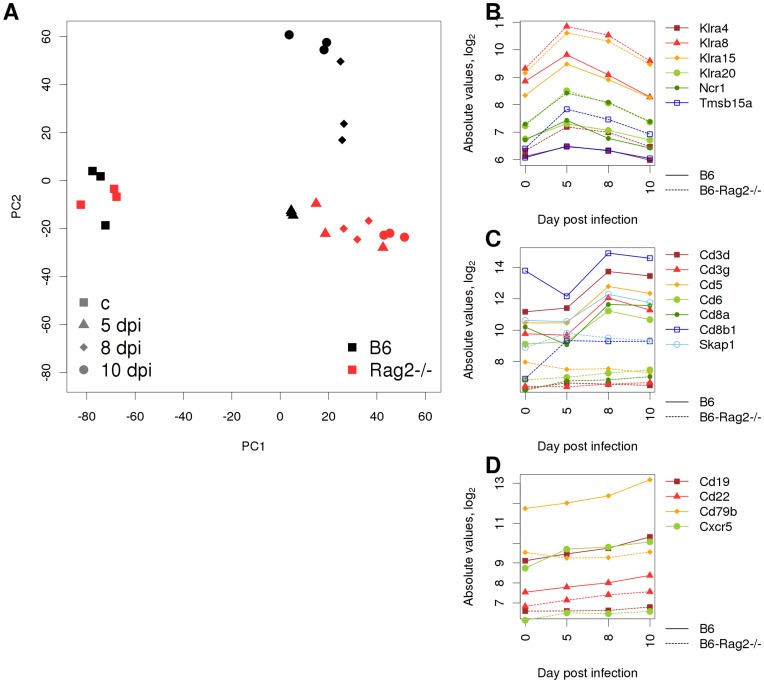
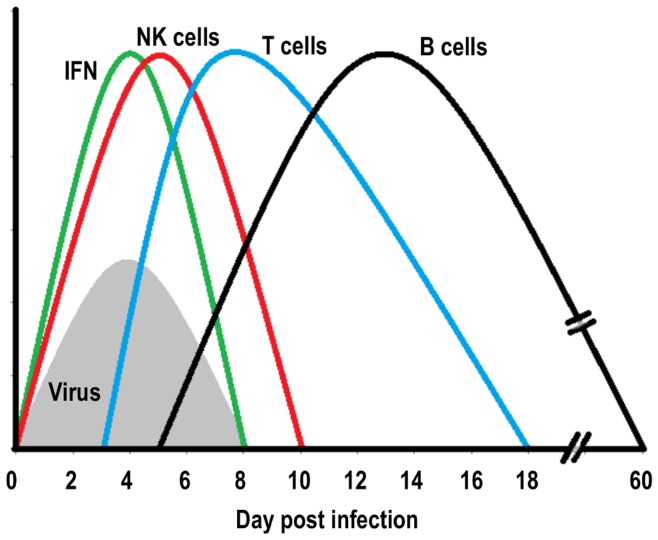
An infection represents a highly dynamic process involving complex biological responses of the host at many levels. To describe such processes at a global level, we recorded gene expression changes in mouse lungs after a non-lethal infection with influenza A virus over a period of 60 days. Global analysis of the large data set identified distinct phases of the host response. The increase in interferon genes and up-regulation of a defined NK-specific gene set revealed the initiation of the early innate immune response phase. Subsequently, infiltration and activation of T and B cells could be observed by an augmentation of T and B cell specific signature gene expression. The changes in B cell gene expression and preceding chemokine subsets were associated with the formation of bronchus-associated lymphoid tissue. In addition, we compared the gene expression profiles from wild type mice with Rag2 mutant mice. This analysis readily demonstrated that the deficiency in the T and B cell responses in Rag2 mutants could be detected by changes in the global gene expression patterns of the whole lung. In conclusion, our comprehensive gene expression study describes for the first time the entire host response and its kinetics to an acute influenza A infection at the transcriptome level.


Conflict of interest statement

Competing Interests: The authors have declared that no competing interests exist.

Figures

Figure 1
Figure 1. Global analysis of gene expression changes in the lungs of influenza infected C57BL/6J mice.
(A) Weight loss of PR8M-infected C57BL/6J mice over two months after infection showing mean values +/− SEM. (B) A Principle Component Analysis (PCA) of all samples taken over the investigated time interval on the basis of the expression of all genes was conducted and single replicates were plotted with reference to the first two principal components (PC1, PC2) covering 57.3% of the variance. Symbols and colors indicate biological replicate samples prepared at the same day p.i. from different individuals. (C) A total of 3,595 differentially expressed (DE) genes were identified over the course of two months after infection. Bars indicate the number of DE genes on each day p.i. Colors indicate the number of DE genes that were newly detected at any given day, e.g. dark red: DE genes newly identified on day 1 p.i. compared to controls; dark green: DE genes that appeared at day 8 p.i. and were not differentially expressed at any time before. y-axis: total number of DE genes, x-axis: day after infection.
Figure 2
Figure 2. Density clustering of expression changes of DE genes in the lungs of influenza infected C57BL/6J mice.
(A) In total, eight different groups of DE genes with similar expression kinetics were identified by cluster analysis as shown in the heat map. (B) The genes for the individual clusters were mapped to significantly associated GO terms of which the most representative terms are depicted. Genes in four clusters were up-regulated and functionally associated with immune responses: Cluster 6 represented a set of 445 DE genes and GO term analysis revealed cytokine production as the most dominating term. Cluster 4 (light green) contained 988 DE genes which were associated with T cell as well as apoptosis-related GO terms. Cluster 2 (orange) contained 37 and cluster 1 (red) 114 genes, respectively, and both were connected to B cell activation. The member genes of each cluster and the results of the GO term analysis are presented in Table S1 and Table S2).
Figure 3
Figure 3. Activation of innate immune responses in C57BL/6J mice after influenza infection.
Expression changes of (A) interferon type I, II, and III and (B) natural killer cell signature genes. Expression changes were represented as differences to the expression levels in mock-infected mice on a log2 scale. Please note that in this figure all interferon genes are depicted, even if they did not exhibit a more than two-fold increase of gene expression during the course of infection. The numbers after the gene names indicate the initial log2 expression values mock-infected control mice at day 2, 4, 14 after treatment. Gene names: interferon alpha 2 (Ifna2); interferon alpha 4 (Ifna4); interferon alpha 5 (Ifna5); interferon alpha 9 (Ifna9); interferon alpha 12 (Ifna12); interferon alpha B (Ifnab); interferon beta 1, fibroblast (Ifnb1); interferon gamma (Ifng); interleukin 28b, interferon lambda (Il28b); killer cell lectin-like receptor, subfamily A, member 4 (Klra4); killer cell lectin-like receptor, subfamily A, member 8 (Klra8); killer cell lectin-like receptor, subfamily A, member 15 (Klra15); killer cell lectin-like receptor subfamily A, member 20 (Klra20); natural cytotoxicity triggering receptor 1 (Ncr1); thymosin beta 15a (Tmsb15a).
Figure 4
Figure 4. Kinetics of expression changes for T cell signature genes after influenza infection of C57BL/6J mice and corresponding T cell infiltration.
(A) Gene expression pattern of T cell signature genes showing the changes in expression levels compared to mock-infected mice (Spearman’s rho ≥0.76 except for Itk). Numbers behind the gene names indicate the initial log2-expression values mock-infected control mice at day 2, 4, 14 after treatment. (B) Dynamics of CD3+ T cell infiltration into infected lungs analyzed by flow cytometry (day 0: non-infected controls). Please note that in this figure all signature genes are depicted, even if they did not exhibit a more than two-fold increase of gene expression during infection. (B.1) Forward (FSC) and sideward scatter (SSC) plot indicating the signals which were selected for further analysis of CD3+ T cells and CD4 and CD8 expression. (B.2) Kinetics of CD3+ cells in lung homogenates calculated as percentage of total events. The mean of three values and the respective SEM are depicted. One representative of two independent experiments is shown. (B.3) Ratio of CD4/CD8 cells within the CD3+ T cell population. Gene names: CD3 antigen, delta polypeptide (Cd3d); CD3 antigen, epsilon polypeptide (Cd3e); CD3 antigen, gamma polypeptide (Cd3g); CD4 antigen (Cd4); CD5 antigen (Cd5); CD6 antigen (Cd6); CD8 antigen, alpha chain (Cd8a); CD8 antigen, beta chain 1 (Cd8b1); IL2-inducible T-cell kinase (Itk); src family associated phosphoprotein 1 (Skap1).
Figure 5
Figure 5. Kinetics of expression changes for B cell signature genes and analogue appearance of B cells in newly induced bronchus-associated lymphoid tissue (BALT) after influenza infection of C57BL/6J mice.
(A) Gene expression changes of B cell signature genes compared to mock-infected mice (Spearman’s rho ≥0.85 except for B3gtn5). (B) Expression of signaling molecules associated with induction of secondary lymphoid organs precedes BALT formation in the lung. Values are given in expression fold changes compared to mock-infected mice. Numbers behind the gene names indicate the initial log2 expression values mock-infected control mice at day 2, 4, 14 after treatment. Please note that in this figure all signature genes are depicted, even if they did not exhibit a more than two-fold increase of gene expression during infection. (C) Histological sections stained for expression of B220 indicating the newly formed BALT at days 5, 10 and 14 p.i. Gene names: UDP-GlcNAc:betaGal beta-1,3-N-acetylglucosaminyltransferase 5 (B3gnt5); B lymphoid kinase (Blk); CD19 antigen (Cd19); CD22 antigen (Cd22); CD79A antigen (immunoglobulin-associated alpha) (Cd79a); CD79B antigen (Cd79b); chemokine (C-X-C motif) receptor 5 (Cxcr5); Fas apoptotic inhibitory molecule 3 (Faim3); chemokine (C-C motif) ligand 19 (Ccl19); chemokine (C-C motif) ligand 21A (serine) (Ccl21a); chemokine (C-X-C motif) ligand 13 (Cxcl13); intercellular adhesion molecule 1 (Icam1); interleukin 7 (Il7); mucosal vascular addressin cell adhesion molecule 1 (Madcam1); tumor necrosis factor (Tnf); tumor necrosis factor (ligand) superfamily, member 11 (Tnfsf11); tumor necrosis factor (ligand) superfamily, member 13b (Tnfsf13b); vascular cell adhesion molecule 1 (Vcam1).
Figure 6
Figure 6. Deficiency in the adaptive immune response of Rag2 knock-out mice monitored by analysis of genome-wide whole lung gene expression data.
(A) A PCA was conducted on all pre-processed probe data of samples from wild type and Rag2 mutant mice and single replicates were plotted with reference to the first two principal components (PC1, PC2). (B) Gene expression changes of NK cell signature genes, (C) of T cell signature genes and (D) of B cell signature genes in wild type (solid lines) and Rag2 mutant (dashed lines) are depicted. T and B cell marker genes were selected exhibiting a rank correlation coefficient of ρ>0.95 to Cd8b1 and Cd19 expression in the long-term study, respectively. Abbreviated gene names: killer cell lectin-like receptor, subfamily A, member 4 (Klra4); killer cell lectin-like receptor, subfamily A, member 8 (Klra8); killer cell lectin-like receptor, subfamily A, member 15 (Klra15); natural cytotoxicity triggering receptor 1 (Ncr1); thymosin beta 15a (Tmsb15a); CD3 antigen, delta polypeptide (Cd3d); CD3 antigen, gamma polypeptide (Cd3g); CD5 antigen (Cd5); CD6 antigen (Cd6); CD8 antigen, alpha chain (Cd8a); CD8 antigen, beta chain 1 (Cd8b1); src family associated phosphoprotein 1 (Skap1); CD19 antigen (Cd19); CD22 antigen (Cd22); CD79B antigen (Cd79b); chemokine (C-X-C motif) receptor 5 (Cxcr5).
Figure 7
Figure 7. Schematic representation of the activation of distinct immune responses in the host lung during an influenza infection.
Increase and decline of viral loads in the infected lungs coincided with the peak of the IFN response. Distinct temporal activation phases can be seen for NK, T and B cell responses. The various waves correspond to schemes shown by , but in addition, a B cell response and a shift in the NK cell response has to be noted for the model of influenza A infection.

Similar articles

Cited by

References

    1. Johnson NP, Mueller J. Updating the accounts: global mortality of the 1918–1920 “Spanish” influenza pandemic. Bull Hist Med. 2002;76:105–115. - PubMed
    1. Fauci AS. Seasonal and pandemic influenza preparedness: science and countermeasures. J Infect Dis. 2006;194:S73–76. - PubMed
    1. Takeuchi O, Akira S. Innate immunity to virus infection. Immunol Rev. 2009;227:75–86. - PMC - PubMed
    1. Pichlmair A, Reise SC. Innate recognition of viruses. Immunity. 2007;27:370–383. - PubMed
    1. Haller O, Weber F. The interferon response circuit in antiviral host defense. Verh K Acad Geneeskd Belg. 2009;71:73–86. - PubMed

Publication types

MeSH terms