

Microbial community analysis of a coastal salt marsh affected by the Deepwater Horizon oil spill
- PMID: 22815990
- PMCID: PMC3399869
- DOI: 10.1371/journal.pone.0041305
Microbial community analysis of a coastal salt marsh affected by the Deepwater Horizon oil spill
Erratum in
- PLoS One. 2012;7(11). doi:10.1371/annotation/72b08ecf-1e78-4668-a094-c818def0e03f
Abstract
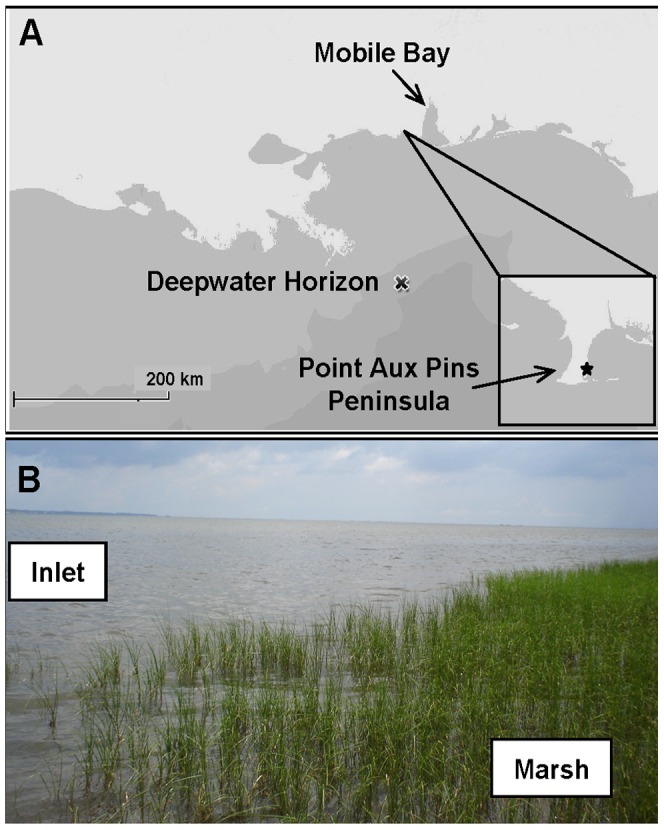
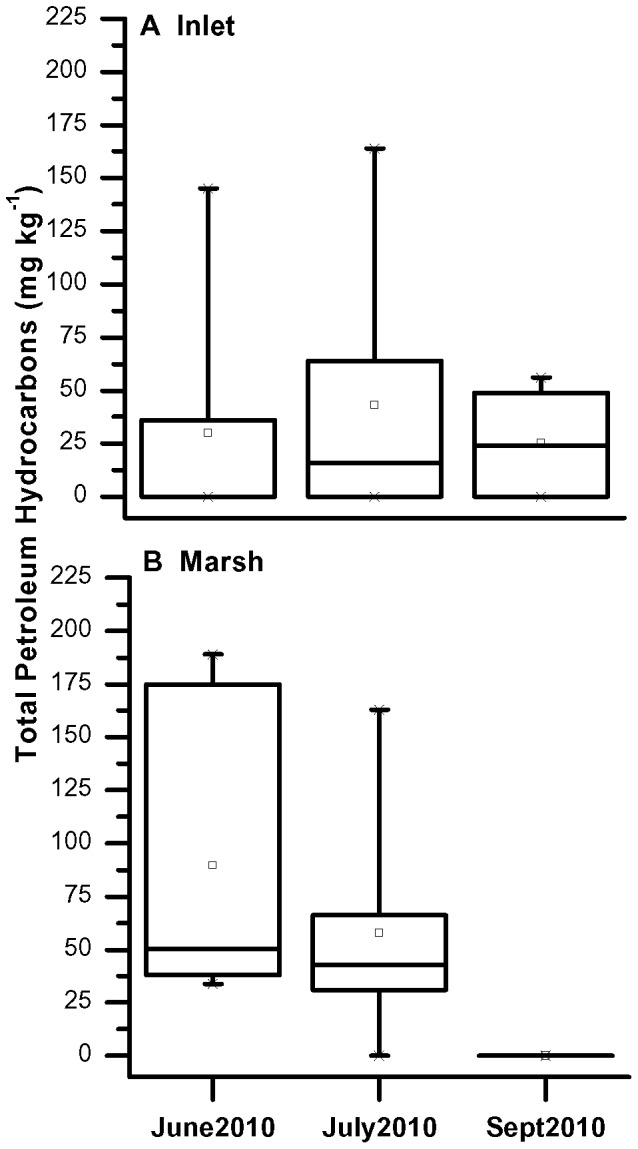
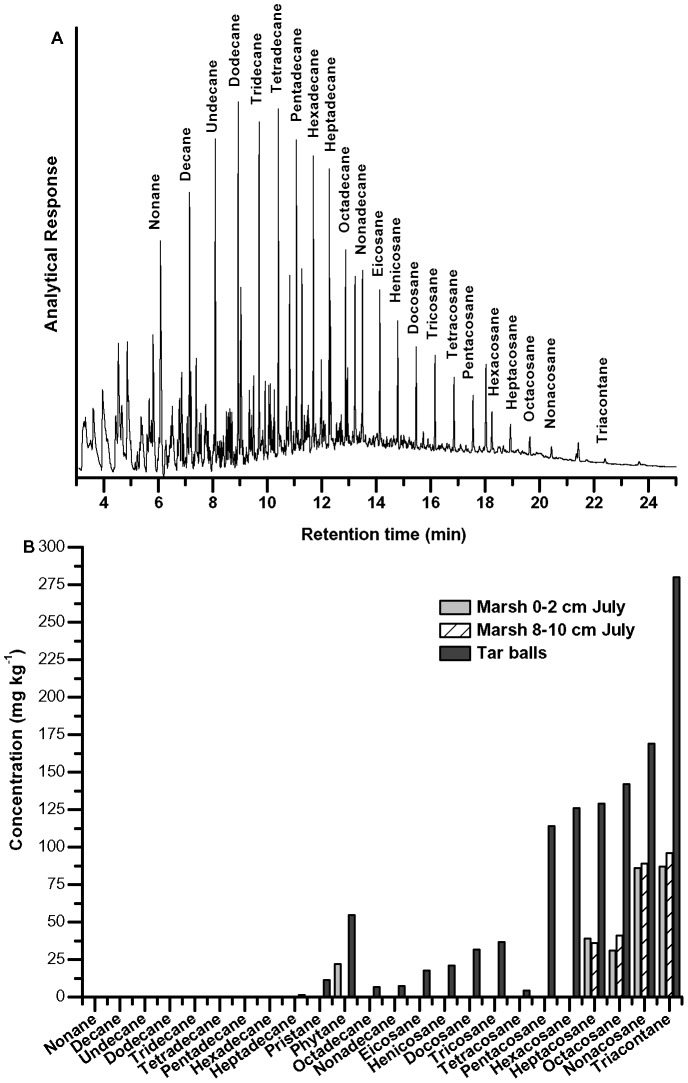
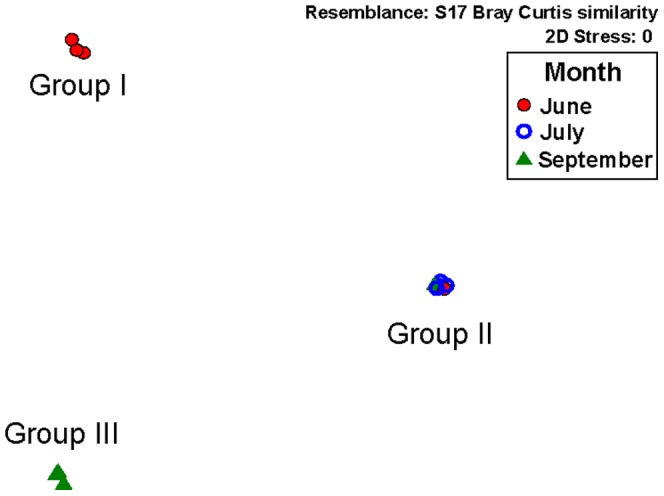
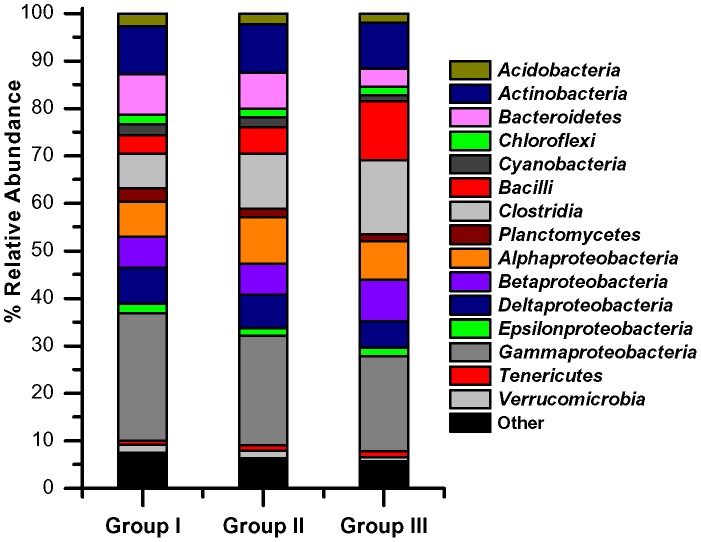
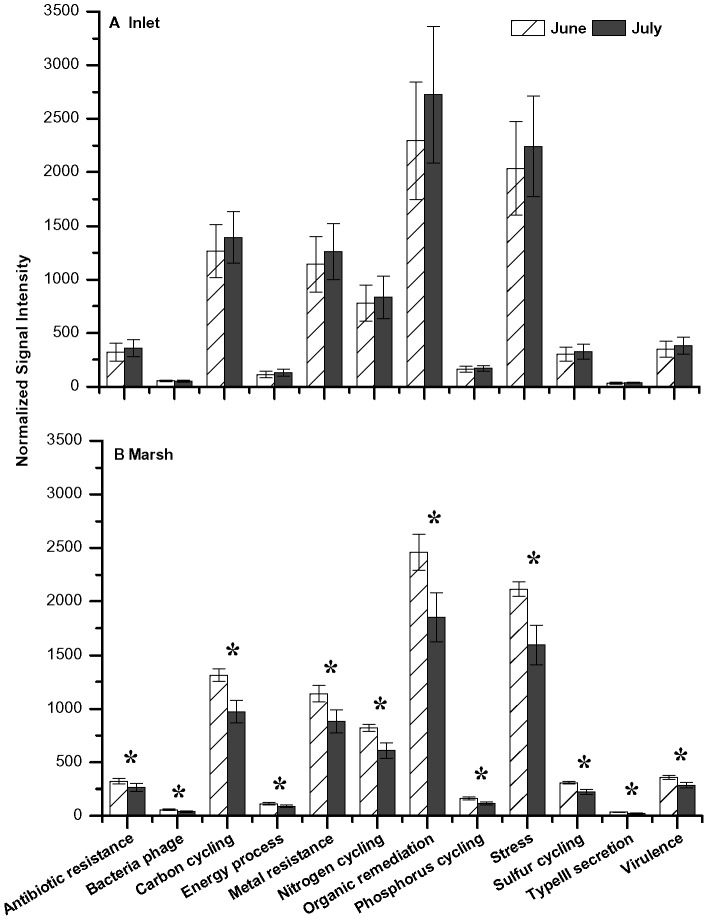
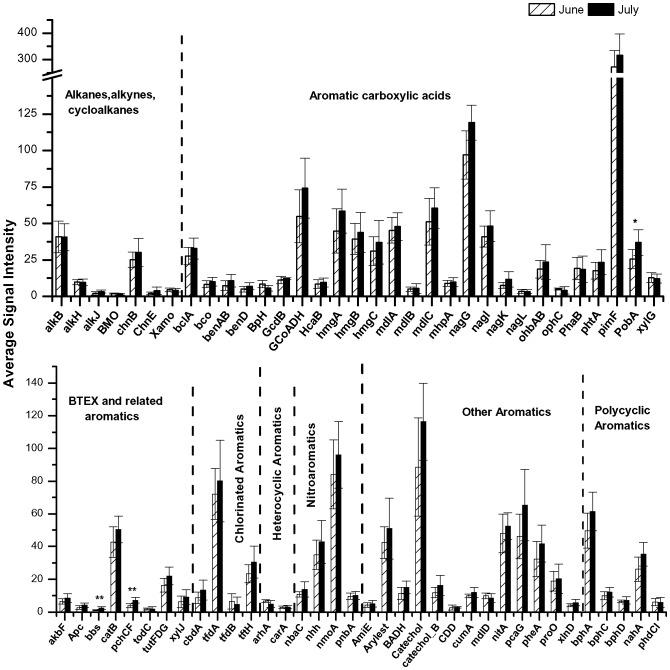
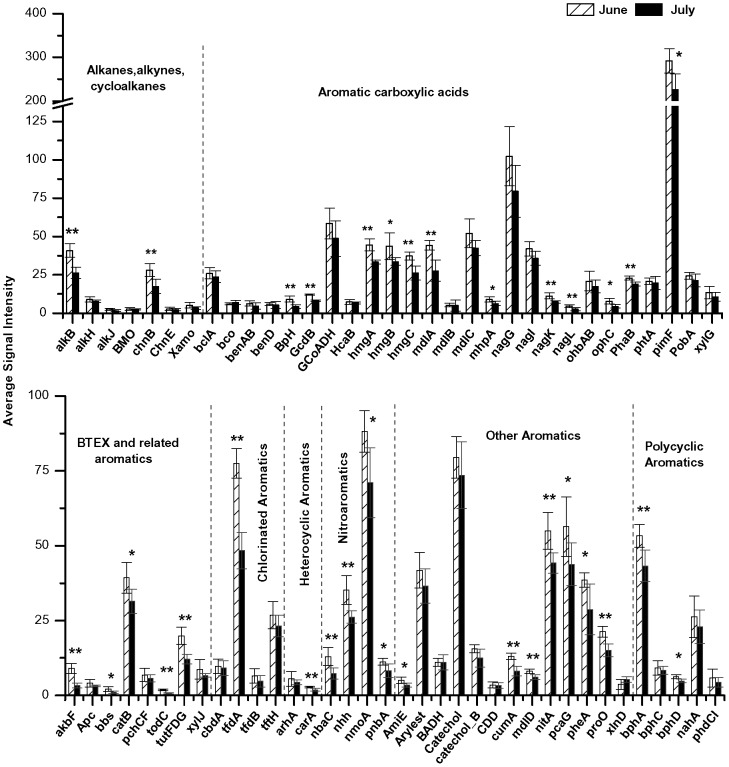
Coastal salt marshes are highly sensitive wetland ecosystems that can sustain long-term impacts from anthropogenic events such as oil spills. In this study, we examined the microbial communities of a Gulf of Mexico coastal salt marsh during and after the influx of petroleum hydrocarbons following the Deepwater Horizon oil spill. Total hydrocarbon concentrations in salt marsh sediments were highest in June and July 2010 and decreased in September 2010. Coupled PhyloChip and GeoChip microarray analyses demonstrated that the microbial community structure and function of the extant salt marsh hydrocarbon-degrading microbial populations changed significantly during the study. The relative richness and abundance of phyla containing previously described hydrocarbon-degrading bacteria (Proteobacteria, Bacteroidetes, and Actinobacteria) increased in hydrocarbon-contaminated sediments and then decreased once hydrocarbons were below detection. Firmicutes, however, continued to increase in relative richness and abundance after hydrocarbon concentrations were below detection. Functional genes involved in hydrocarbon degradation were enriched in hydrocarbon-contaminated sediments then declined significantly (p<0.05) once hydrocarbon concentrations decreased. A greater decrease in hydrocarbon concentrations among marsh grass sediments compared to inlet sediments (lacking marsh grass) suggests that the marsh rhizosphere microbial communities could also be contributing to hydrocarbon degradation. The results of this study provide a comprehensive view of microbial community structural and functional dynamics within perturbed salt marsh ecosystems.
Conflict of interest statement
Figures
References
-
- Camilli R, Reddy CM, Yoerger DR, Van Mooy BAS, Jakuba MV, et al. Tracking Hydrocarbon Plume Transport and Biodegradation at Deepwater Horizon. Science. 2010;330:201–204. - PubMed
-
- Camilli R, Di Iorio D, Bowen A, Reddy CM, Techet AH, et al. Acoustic measurement of the Deepwater Horizon Macondo well flow rate. Proc Natl Acad Sci USA. 2011. DOI: 10.1073/pnas.1100385108. - DOI - PMC - PubMed
-
- Reddy CM, Arey JS, Seewald JS, Sylva SP, Lemkau KL, et al. Composition and fate of gas and oil released to the water column during the Deepwater Horizon oil spill. P Natl Acad Sci USA. 2011. DOI: 10.1073/pnas.1101242108. - DOI - PMC - PubMed
-
- Operational Science Advisory Team. Summary Report for the Fate and Effects of Remnant Oil Remaining in the Beach Environment. 2011. Available: http://www.restorethegulf.gov/sites/default/files/documents/pdf/Annex%20.... Accessed 8 June 2012.
Publication types
MeSH terms
Substances
LinkOut - more resources
Full Text Sources
Medical
