. 2012 Dec 15;17(12):1676-93.
doi: 10.1089/ars.2011.4474. Epub 2012 Sep 14.

Glutaredoxin 1 protects dopaminergic cells by increased protein glutathionylation in experimental Parkinson's disease

Affiliations

Glutaredoxin 1 protects dopaminergic cells by increased protein glutathionylation in experimental Parkinson's disease

Humberto Rodriguez-Rocha et al. Antioxid Redox Signal. .

Abstract

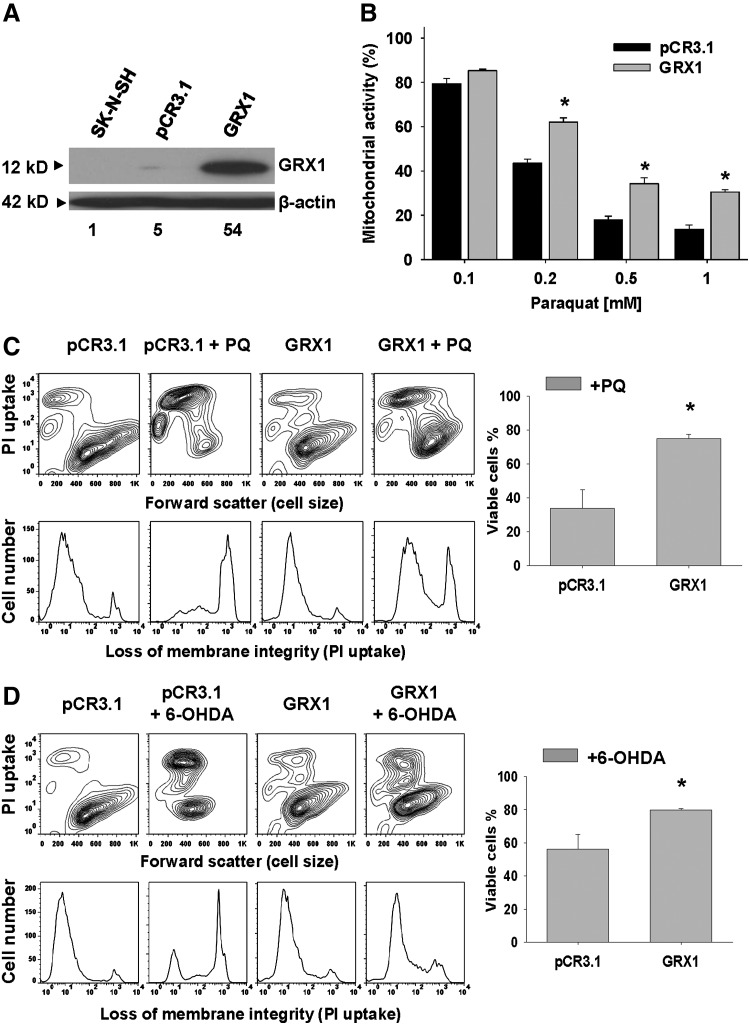
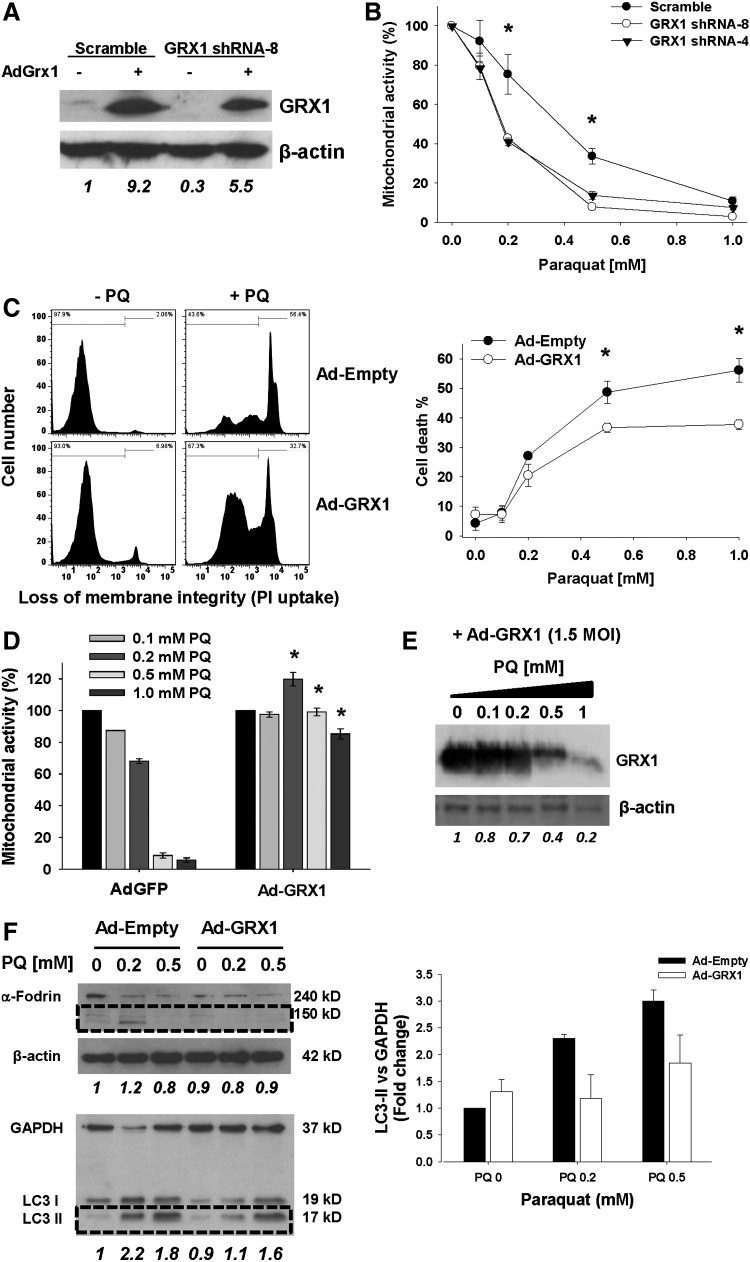
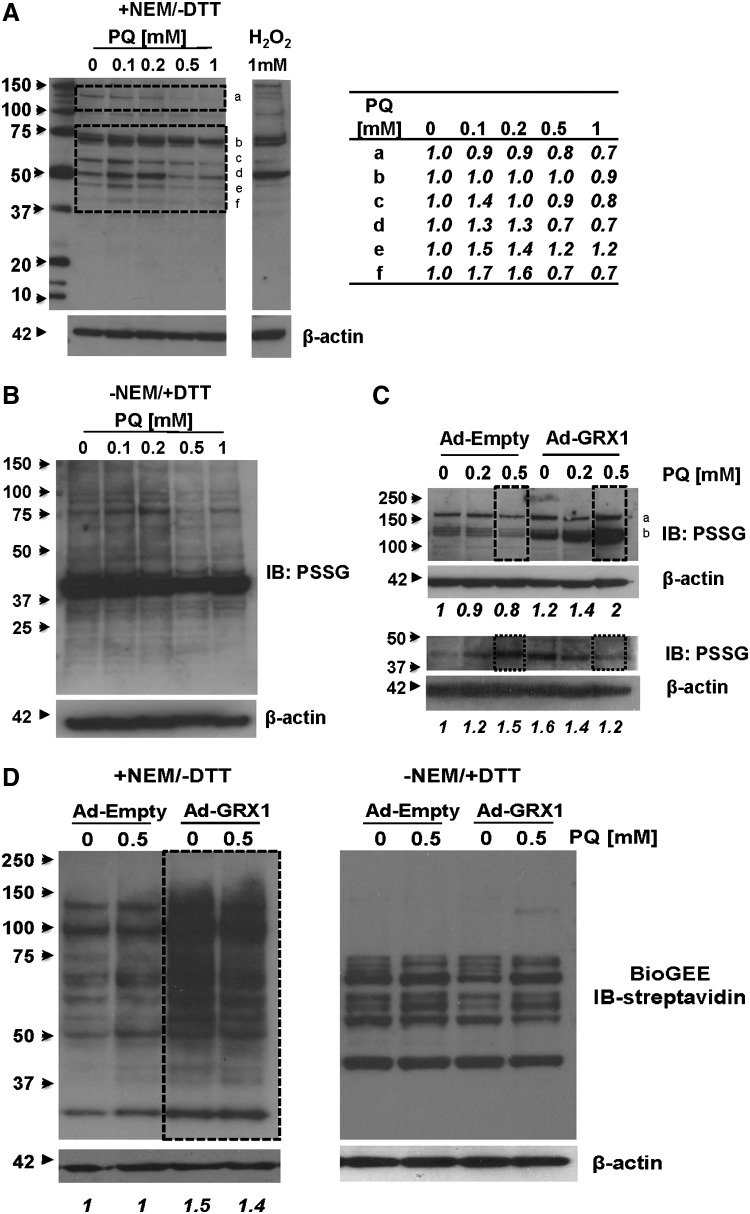
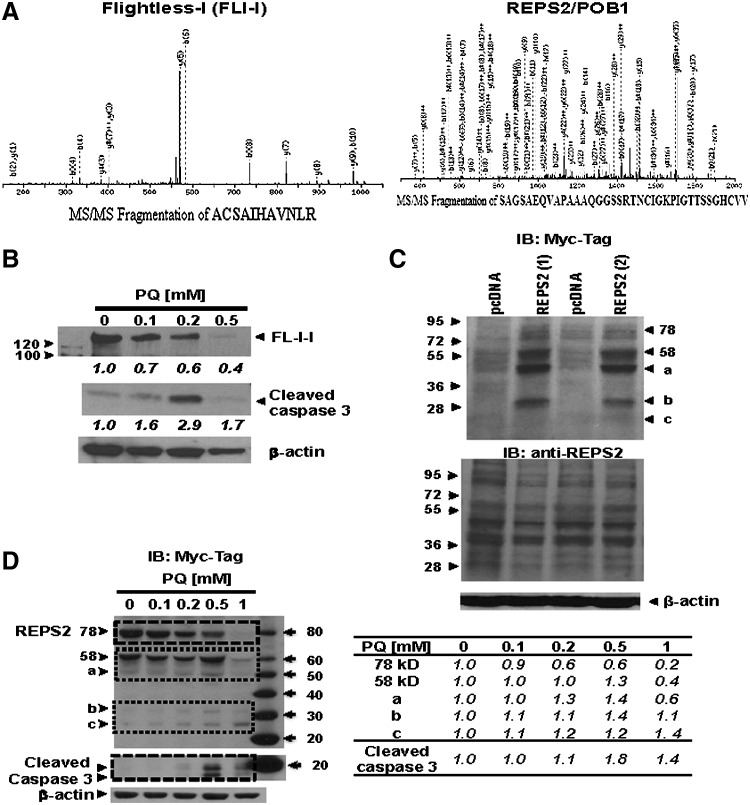
Aims: Chronic exposure to environmental toxicants, such as paraquat, has been suggested as a risk factor for Parkinson's disease (PD). Although dopaminergic cell death in PD is associated with oxidative damage, the molecular mechanisms involved remain elusive. Glutaredoxins (GRXs) utilize the reducing power of glutathione to modulate redox-dependent signaling pathways by protein glutathionylation. We aimed to determine the role of GRX1 and protein glutathionylation in dopaminergic cell death.

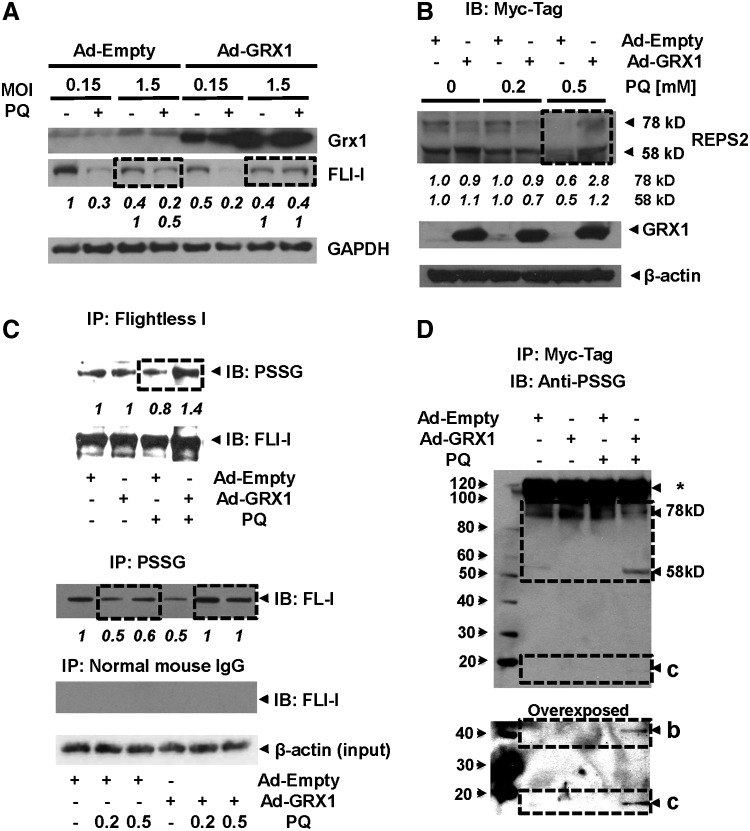
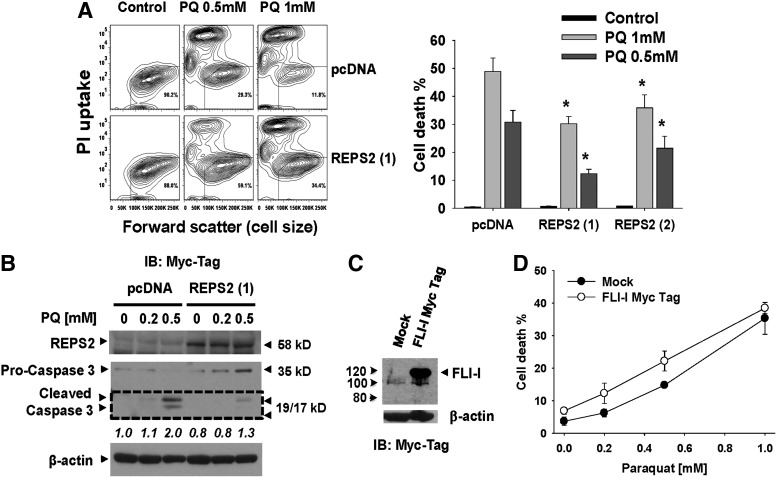
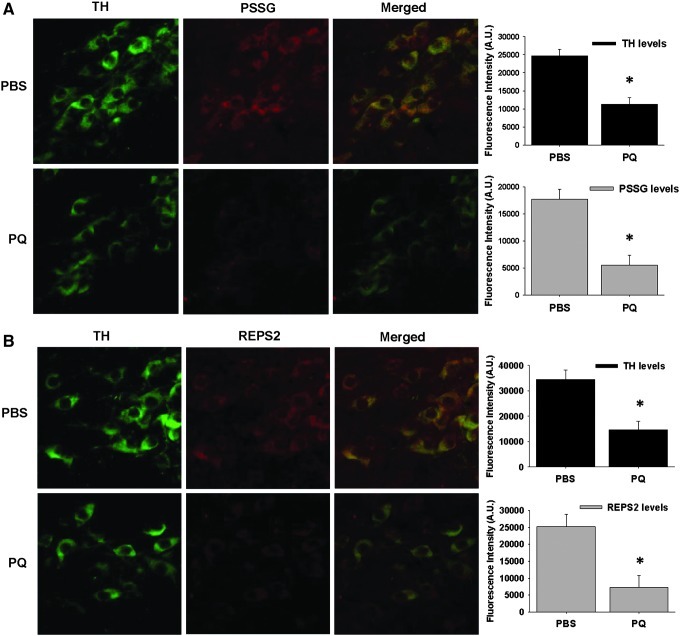
Results: In dopaminergic cells, toxicity induced by paraquat or 6-hydroxydopamine (6-OHDA) was inhibited by GRX1 overexpression, while its knock-down sensitized cells to paraquat-induced cell death. Dopaminergic cell death was paralleled by protein deglutathionylation, and this was reversed by GRX1. Mass spectrometry analysis of immunoprecipitated glutathionylated proteins identified the actin binding flightless-1 homolog protein (FLI-I) and the RalBP1-associated Eps domain-containing protein 2 (REPS2/POB1) as targets of glutathionylation in dopaminergic cells. Paraquat induced the degradation of FLI-I and REPS2 proteins, which corresponded with the activation of caspase 3 and cell death progression. GRX1 overexpression reduced both the degradation and deglutathionylation of FLI-I and REPS2, while stable overexpression of REPS2 reduced paraquat toxicity. A decrease in glutathionylated proteins and REPS2 levels was also observed in the substantia nigra of mice treated with paraquat.

Innovation: We have identified novel protein targets of glutathionylation in dopaminergic cells and demonstrated the protective role of GRX1-mediated protein glutathionylation against paraquat-induced toxicity.

Conclusions: These results demonstrate a protective role for GRX1 and increased protein glutathionylation in dopaminergic cell death induced by paraquat, and identify a novel protective role for REPS2.


Figures

FIG. 1.
FIG. 1.
Stable overexpression of GRX1 protects against dopaminergic cell death induced by paraquat and 6-OHDA. Human dopaminergic SK-N-SH cells were stably transfected with empty pCR3.1 vector and pCR3.1 vector encoding human GRX1 (A). In B–D, the effect of GRX1 overexpression against cell death induced by a 48 h treatment with paraquat (0.5 mM in C) or 6-OHDA (50 μM) (D) was analyzed by determination of mitochondrial activity (B) and cell viability (C and D). Mitochondrial activity (B) was assessed by measuring the conversion of the tetrazolium salt, MTT. Loss of cell viability or plasma membrane integrity is reflected by the increase in the number of cells with increased PI fluorescence (plots and bar graphs in C and D). Data in bar graphs represent % of viable cells from paraquat (C) and 6-OHDA (D) treated cells and are means±SEM of four independent experiments. *p<0.05, significant difference between GRX1 and pCR3.1 values. Contour plots and Western blots are representative of 2–4 independent experiments. Numbers in A represent the densitometry analysis with respect to SK-N-SH cells normalized to β-actin.
FIG. 2.
FIG. 2.
Adenovirus-mediated overexpression of GRX1 and shRNA knock-down regulate dopaminergic cell death induced by paraquat. Overexpression of GRX1 by recombinant adenovirus Ad5CMV-GRX1 (1.5 MOI) and GRX1 knock-down with shRNA lentiviral particles were determined by Western blot (A). The effect of GRX1 overexpression (C and D) and knock-down (B) on the loss of mitochondrial activity (B and D) and cell death (C) induced by paraquat was determined as in Figure 1. In E, the effect of paraquat (48 h treatment) on the overexpression of GRX1 induced by Ad5CMV-GRX1 (1.5 MOI) was evaluated. Cleavage of α-fodrin (apoptotic marker) and accumulation of LC3-II (autophagy marker) induced by paraquat were also determined by Western blot in whole cell lysates (F). Control adenovirus contained only the cytomegalovirus promoter (AdEmpty) and/or the green fluorescent protein gene as a reporter (AdGFP). Data in graphs represent means±SEM of four independent experiments. *p<0.05, shRNA4 and 8 vs Scramble (C), or GRX1 vs. Empty values (D). Plots in (C) represent 0.5 mM PQ treatments. Contour plots and Western blots are representative of 3–4 independent experiments. Numbers in blots (italics) represent the densitometry analyses with respect to Scramble (A), Ad-GRX1 (E), and Ad-Empty samples (F) normalized to β-actin or GAPDH.
FIG. 3.
FIG. 3.
Paraquat-induced alterations in glutathionylated proteins. Whole cell lysates of cells treated with or without paraquat for 48 h were isolated and analyzed under reducing (-NEM/+DTT) and nonreducing (+NEM/-DTT) conditions. In A and B, protein glutathionylation was assessed using anti-PSSG antibody in samples isolated in the presence or absence of >30 mM NEM. In C, overexpression of GRX1 was induced via adenoviral transduction (1.5 MOI) as described in Figure 2. C represents a composite of two independent Western blot with their corresponding loading controls. In D, protein glutathionylation was assessed as previously described in cells labeled with BioGEE (250 μM) 1 h prior to experimental treatments, and glutathionylated proteins were visualized using streptavidin-HRP conjugate. Blots were probed with β-actin to determine equal loading. Blots are representative of at least 3 independent experiments. Numbers in blots (italics) represent the densitometry analyses with respect to control (A, table), and Ad-Empty samples (C and D) normalized to β-actin.
FIG. 4.
FIG. 4.
Paraquat toxicity is associated with downregulation of FLI-I and REPS2. (A) Glutathionylated proteins immunoprecipitated with anti-PSSG antibody were processed for mass spectrometry. Samples were digested with trypsin and peptides were subjected to LC/MS/MS analysis using reverse phase chromatography mass spectrometry. Two of the acquired spectrum of peptides identified by mass spectrometry analysis corresponded to FLI-I (ACSAIHAVNLR) and REPS2 SAGSAEQVAPAAAQGGSSRTNCIGKPIGTTSSGHCVV), identified using a human data base (IPI-Human, NCBI). (See Supplementary Fig. S1 for a magnification of the MS spectra). Alterations in the levels of FLI-I, REPS2 and cleaved caspase 3 induced by paraquat were assessed in wild-type (B) and stable SK-N-SH overexpressing Myc-His REPS2 (D). In (C) and (D), REPS2 protein levels were visualized in stable Myc-His REPS2 overexpressing clones (clone 2 was used in D) using anti-myc-tag (upper panel) or anti-REPS2 (K-18) (lower panel) antibody. a–c labels in C and D (including the table) represent possible isoforms or degradation products of REPS2. Blots were reprobed with β-actin to corroborate equal loading and are representative of at least 3 independent experiments. Table corresponds to the densitometry analysis of protein bands in D. Numbers (italics) in (B) and (D) represent the densitometry analyses with respect to control samples (D, table) normalized to β-actin.
FIG. 5.
FIG. 5.
GRX1 regulates protein expression levels and glutathionylation of FLI-I and REPS2. In (A) and (B), overexpression of GRX1 (Ad-GRX1) reduced paraquat-induced FLI-I and REPS2 downregulation (broken line rectangles). SK-N-SH (A and C) and cells stably expressing Myc/His REPS2 (B and D) were infected with Ad-Empty or Ad-GRX1 (1.5 MOI) for 24 h and subsequently treated with paraquat (0.2 mM in A, C upper panel, and D) for 48 h. Samples were collected under nonreducing conditions (+NEM/-DTT). In C (upper panel) and D, FLI-I and REPS2 were immunoprecipitated with anti-FLI-I or anti-MycTag antibodies respectively, and then, PSSG were visualized using anti-PSSG antibody. Blot in (C, upper panel) was reprobed with anti-FLI-I to corroborate equal levels of immunoprecipitated proteins. In (C, lower panel), glutathionylated proteins were immunoprecipiated with anti-PSSG antibody and FLI-I levels were visualized using the corresponding antibody. As controls, samples were pre-cleared with Dynabeads coupled with normal mouse IgG. Normal mouse IgG did not pull down FLI-I. Blots are representative of at least 3 independent experiments. Numbers in blots (italics) represent the densitometry analyses with respect to Ad-Empty samples [0.15 MOI, upper numbers; and 1.5 MOI lower numbers in (A)], normalized to the corresponding loading/input control.
FIG. 6.
FIG. 6.
Paraquat-induced dopaminergic cell death is significantly reduced by REPS2/POB1 overexpression. (A) SK-N-SH cells overexpressing empty pcDNA3.1 or Myc-His REPS2 were treated with paraquat for 48 h. Cell death was determined by the loss of plasma membrane integrity (PI uptake) and cell shrinkage as a marker of apoptosis. % of dead cells in A (bar graph) reflects the number of cells with increased PI fluorescence using two distinct clones overexpressing Myc-His REPS2 (See Fig. 4C). In B, paraquat-induced cleavage/activation of caspase 3 in both pcDNA3.1 and REPS2 overexpressing cells was evaluated as explained in Figure 2. In C and D, cells were transiently transfected with Myc-tagged FLI-I for 24 h prior paraquat treatment. Expression levels of FLI-I were corroborated by Western blot (C) and the effect of FLI-I overexpression on paraquat-induced dopaminergic cell death was determined as explained in A. Data in A (bar graphs) and D are means±SEM of four independent experiments. *p<0.05, significant difference between the corresponding REPS2 and pcDNA3.1 values. Contour plots and western blots are representative of 3–4 independent experiments. Numbers in B (italics) represent the densitometry analyses of cleaved caspase 3 with respect to pcDNA normalized to β-actin.
FIG. 7.
FIG. 7.
Alterations in PSSG and REPS2 in the substantia nigra of mice treated with paraquat. C57BL/6 mice (8–10 weeks old) were administered two intraperitoneal injections of 10 mg/kg PQ or PBS every week for 3 consecutive weeks. Animals were analyzed 1 week after the last injection and coronal sections of the substantia nigra were stained with anti-TH (A and B) and anti-PSSG (A) or anti-REPS2 (B) antibody. Sections were incubated in secondary Alexa 488-anti-rabbit (TH) and Alexa 633-anti-mouse (PSSG and REPS2). Sections were mounted with VectaShield and images were collected on a LSM 5 Exciter confocal scanning fluorescent microscope (20 ×) and Zen 2008 software (Carl Zeiss). Fluorescence intensity analysis was performed using ImageJ (NIH) software. Corrected total cell fluorescence (CTCF) was obtained and expressed as Arbitrary Fluorescence Intensity Units (A.U.).
FIG. 8.
FIG. 8.
Proposed mechanism by which paraquat-induced oxidative stress and GRX1 might regulate protein glutathionylation and deglutathionylation distinctively. Protein glutathionylation has been demonstrated to occur by a variety of mechanisms, reviewed in (55, 88). (A) PSSG formation might occur by thiol exchange reactions between protein cysteines and GSSG, but this mechanism requires unusually high redox potential. Interestingly, under oxidizing conditions (low GSH/GSSG ratio) GRX1 can use GSSG to promote PSSG formation. Paraquat-induced↑RS might enhance GRX1-mediated glutathionylation by increasing the GSSG pool (dotted line). (B) Under reducing conditions, GRX1 utilizes the reducing power of GSH to catalyze protein deglutathionylation. Paraquat-induced reactive species (↑ RS) formation might prevent GRX1-mediated deglutathionylation by depletion of intracellular GSH content (broken lines). On the other hand, two (H2O2, •ONOO-) or one-electron (•O2-) cysteine oxidation by RS leads to the formation of reactive intermediates including cysteine sulfenic acids (PSOH) (C) and protein thiyl radicals (PS•) (D), respectively, which can participate in disulfide bond formation with GSH leading to PSSG formation (E). In addition, GS• generation by oxidative stress has been shown to lead to PSSG formation catalyzed by GRXs (not depicted here). This is another potential mechanism by which GRX1 overexpression might increase protein glutathionylation upon paraquat exposure. Paraquat-induced RS formation and GSH depletion mediated by increased activation of glutathione peroxidase (GPX) (broken lines) might enhance cysteine oxidation and also prevent/reverse cysteine glutathionylation leading to their irreversible oxidation (G). Thus, glutathionylation/deglutathionylation depends on the spacial localization of the targeted protein, surrounding redox environment, the nature of the RS involved and expression levels of GRXs (F).

References

    1. Alam ZI. Daniel SE. Lees AJ. Marsden DC. Jenner P. Halliwell B. A generalised increase in protein carbonyls in the brain in Parkinson's but not incidental Lewy body disease. J Neurochem. 1997;69:1326–1329. - PubMed
    1. Alam ZI. Jenner A. Daniel SE. Lees AJ. Cairns N. Marsden CD. Jenner P. Halliwell B. Oxidative DNA damage in the parkinsonian brain: An apparent selective increase in 8-hydroxyguanine levels in substantia nigra. J Neurochem. 1997;69:1196–1203. - PubMed
    1. Aon-Bertolino ML. Romero JI. Galeano P. Holubiec M. Badorrey MS. Saraceno GE. Hanschmann EM. Lillig CH. Capani F. Thioredoxin and glutaredoxin system proteins-immunolocalization in the rat central nervous system. Biochim Biophys Acta. 2011;1810:93–110. - PubMed
    1. Archer SK. Claudianos C. Campbell HD. Evolution of the gelsolin family of actin-binding proteins as novel transcriptional coactivators. Bioessays. 2005;27:388–396. - PubMed
    1. Ascherio A. Chen H. Weisskopf MG. O'Reilly E. McCullough ML. Calle EE. Schwarzschild MA. Thun MJ. Pesticide exposure and risk for Parkinson's disease. Ann Neurol. 2006;60:197–203. - PubMed

Publication types