. 2012 Jul 20;150(2):279-90.
doi: 10.1016/j.cell.2012.05.043.

Transcript dynamics of proinflammatory genes revealed by sequence analysis of subcellular RNA fractions

Affiliations

Transcript dynamics of proinflammatory genes revealed by sequence analysis of subcellular RNA fractions

Dev M Bhatt et al. Cell. .

Abstract

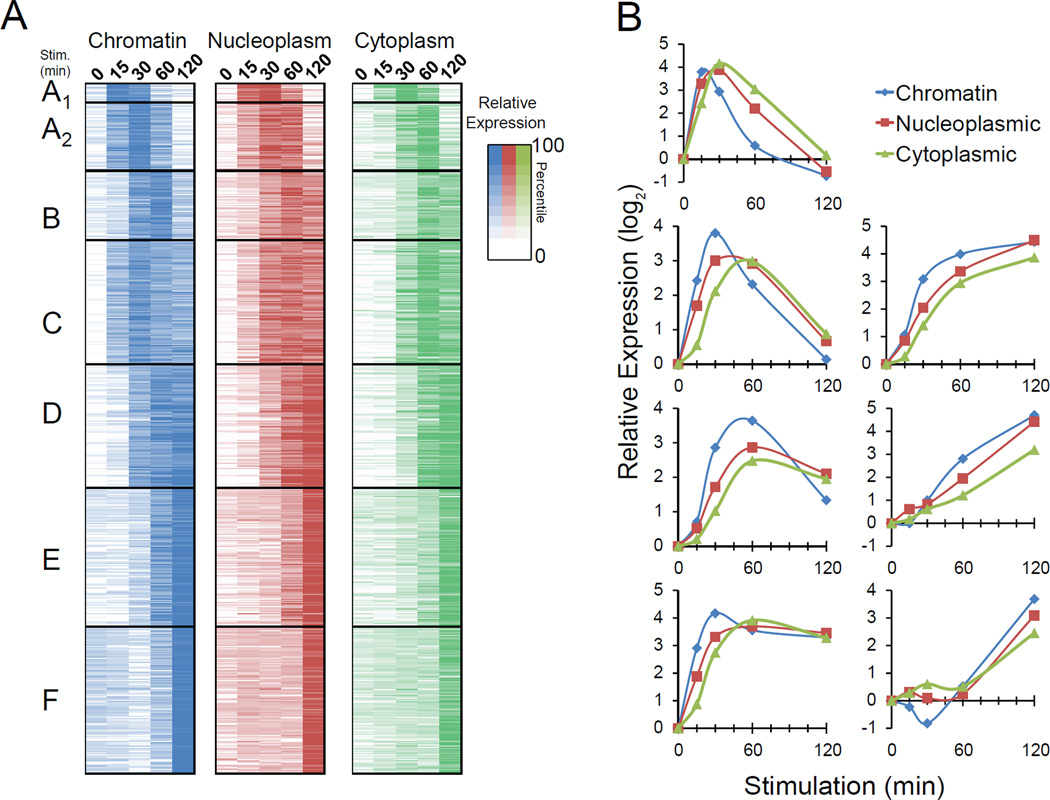
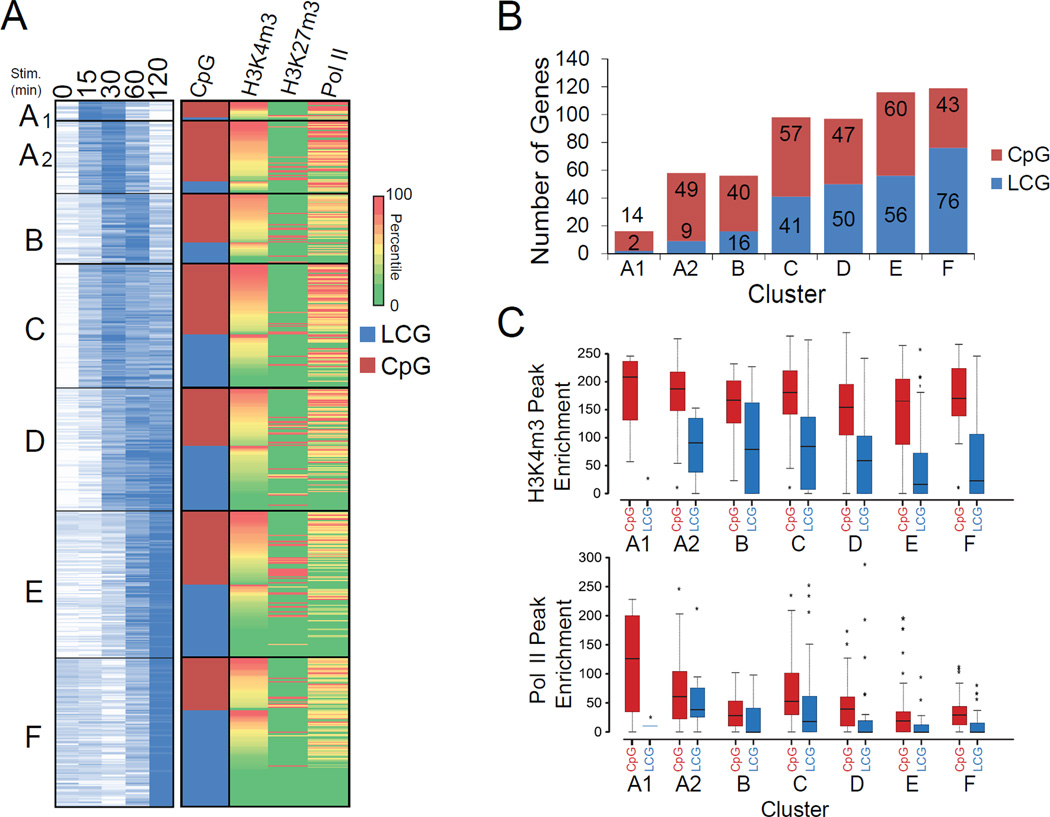
Macrophages respond to inflammatory stimuli by modulating the expression of hundreds of genes in a defined temporal cascade, with diverse transcriptional and posttranscriptional mechanisms contributing to the regulatory network. We examined proinflammatory gene regulation in activated macrophages by performing RNA-seq with fractionated chromatin-associated, nucleoplasmic, and cytoplasmic transcripts. This methodological approach allowed us to separate the synthesis of nascent transcripts from transcript processing and the accumulation of mature mRNAs. In addition to documenting the subcellular locations of coding and noncoding transcripts, the results provide a high-resolution view of the relationship between defined promoter and chromatin properties and the temporal regulation of diverse classes of coexpressed genes. The data also reveal a striking accumulation of full-length yet incompletely spliced transcripts in the chromatin fraction, suggesting that splicing often occurs after transcription has been completed, with transcripts retained on the chromatin until fully spliced.


Figures

Figure 1
Figure 1. RNA-Seq Read Distributions and Induction Kinetics for Nfkb1 Transcripts
(A) The distribution of RNA-Seq reads at the Nfkb1 locus is shown for libraries prepared from cytoplasmic, nucleoplasmic and chromatin-associated RNA. Time points and scale are indicated at the left. Exons and introns are shown at the bottom, and the TSS is indicated (bent arrow). (B) Nfkb1 transcript levels in each of the three fractions through the time-course are shown as fold-induction values relative to the unstimulated transcript values (determined from RPKMs). See also Figure S1.
Figure 2
Figure 2. Distributions of Transcripts in the Three Subcellular Fractions
(A) RefSeq genes exceeding 400-bp in length and exhibiting an RPKM of at least one in one of the samples were divided into 12 clusters on the basis of their pattern of transcript levels in the three subcellular fractions and five time points. Colors indicate the percentile of the relative expression level. (B) The average relative transcript levels within representative clusters are shown. Although relative cluster-to-cluster differences are of interest, absolute transcript abundances in each sub-cellular compartment cannot be determined because of possible variability in RNA isolation efficiencies from the three fractions. (C) The number and percentage (parenthesis) of genes within each of the 12 clusters in panel A are shown. See also Figure S2.
Figure 3
Figure 3. Kinetic Analysis of Lipid A-Induced Transcripts
(A) Lipid A-induced genes were divided into six classes (A–F) on the basis of their chromatin-associated transcript profiles. Class A was divided into Classes A1 and A2 to highlight 16 genes that exhibit peak or near-peak transcript levels at the 15-min time point. Nucleoplasmic and cytoplasmic transcript levels were aligned on the basis of the clustering of chromatin transcripts. Transcript values are normalized to the average RPKM for each fraction. Colors indicate percentile values. (B) The average fold induction within each class (y-axis) is shown for each time point (x-axis). Chromatin (blue), nucleoplasmic (red), and cytoplasmic (green) transcripts were analyzed separately. See also Figures S3, S4, and S5.
Figure 4
Figure 4. Promoter and Chromatin Properties of Co-Expressed Genes
(A) The distribution of CpG-island promoters was determined for each class from Figure 3 on the basis of expression kinetics of chromatin-associated transcripts. Levels of histone H3K4me3, H3K27me3, and RNA polymerase II at the promoters in unstimulated cells is shown. ChIP-Seq values represent the signal within a 1 kb window centered on the TSS. Each column is normalized to the average enrichment at all inducible promoters, and color-coded according to percentile. (B) The number of genes that contain CpG island (red) or LCG (blue) promoters within each co-expressed class is shown. (C) The quantitative distributions of promoter-associated histone H3K4me3 (top) and RNA polymerase II (bottom) in unstimulated cells is shown for each class subdivided by promoter CpG content. The scale of the boxplots represents the intensity of ChIP-Seq peaks as determined in De Santa et al. (2009).
Figure 5
Figure 5. Dynamic Ranges of Expression within Co-Expression Classes
(A) Chromatin-associated transcript levels (RPKMs) in unstimulated macrophages are shown for all genes in each class. Genes containing CpG-island promoters (diamonds) and LCG promoters (stars) are shown separately. The median transcript level for each group is indicated by a black bar. (B) Chromatin-associated transcript levels (RPKMs) at their peak time point are shown for all genes in each class, with CpG-island and LCG promoters shown separately. (C) The maximum fold-induction of chromatin transcripts for each gene is shown, by dividing the peak RPKM by the RPKM in unstimulated cells. Representative genes with LCG promoters that exhibit strong activation are indicated. (D) The numbers of genes in each class activated by more than 100-fold and by only 5–10-fold are shown. (E) Over-represented transcription factor binding sites are shown for each class. Data are presented after hierarchical clustering. CpG-island and LCG promoters were analyzed separately. Transcription factor families are shown at the right (see Figure S6A for details). Color intensity is proportional to the negative log(p-value). Single and double stars indicate p-values < 0.01 and < 0.001, respectively. See also Figure S6.
Figure 6
Figure 6. High Prevalence of Completed Transcripts Cleaved at the Polyadenylation Site in the Chromatin Samples
(A) Normalized read distributions from the 5’ to 3’ end of all genes within each class are shown for each time point. Data from chromatin-associated transcripts were used and genes were normalized for length. Relative gene position is shown on the x-axis and cumulative reads at each relative position are shown on the y-axis. (B) Cumulative read distributions spanning the polyadenylation site are shown for lipid A-induced genes. The x-axis shows the gene position relative to the polyadenylation cleavage site and the y-axis shows cumulative reads at each position. (C) Read profiles are shown for chromatin-associated transcripts at the Il12b locus. Time points and scale are shown at the left and exon-intron structure of the locus is at the bottom. In the nucleoplasmic and cytoplasmic fractions, abundant exonic reads accumulated by the 60-minute time point (not shown).
Figure 7
Figure 7. Analysis of Exon:Intron Ratios and a Comparison of Nascent Transcript Methods
(A) Reads mapping to approximately 1,450 genes from Cluster 11 (Figure 2) were analyzed for relative exon and intron coverage. The genes were rank-ordered according to splicing levels (length-normalized exon reads over total reads) in the chromatin fraction (blue), and were compared to splicing levels in the nucleoplasm (red) and cytoplasm (green). Similar results were obtained with all gene clusters (data not shown). (B) RNA-Seq read distributions at Nfkb1 are shown comparing reads from the cytoplasmic (green), nucleoplasmic (red), and chromatin (blue) fractions to data obtained by 4sU-Seq and GRO-Seq (Rabani et al. 2011; Escoubet-Lozach et al. 2011). GRO-Seq was performed with LPS-stimulated bone marrow-derived macrophages. 4sU-Seq was performed with LPS-stimulated bone marrow-derived dendritic cells. The fifth track displays the 4sU-Seq data with a scale of 15 reads to show the reduced number of reads after the polyadenylation site relative to the last intron. The cleavage site (red arrow) and reads representing transcription past this site (green bracket; abundant only in the GRO-Seq data set) are indicated. See also Figure S7.

Comment in

References

    1. Adelman K, Kennedy MA, Nechaev S, Gilchrist DA, Muse GW, Chinenov Y, Rogatsky I. Immediate mediators of the inflammatory response are poised for gene activation through RNA polymerase II stalling. Proc. Natl. Acad. Sci. USA. 2009;106:18207–18212. - PMC - PubMed
    1. Amit I, Garber M, Chevrier N, Leite AP, Donner Y, Eisenhaure T, Guttman M, Grenier JK, Li W, Zuk O, et al. Unbiased reconstruction of a mammalian transcriptional network mediating pathogen responses. Science. 2009;326:257–263. - PMC - PubMed
    1. Brody Y, Neufeld N, Bieberstein N, Causse SZ, Bohnlein EM, Neugebauer KM, Darzacq X, Shav-Tal Y. The in vivo kinetics of RNA polymerase II elongation during co-transcriptional splicing. PLoS Biol. 2011;9:e1000573. - PMC - PubMed
    1. Caput D, Beutler B, Hartog K, Thayer R, Brown-Shimer S, Cerami A. Identification of a common nucleotide sequence in the 3’-untranslated region of mRNA molecules specifying inflammatory mediators. Proc. Natl. Acad. Sci. USA. 1986;83:1670–1674. - PMC - PubMed
    1. Chen Q, Jagannathan S, Reid DW, Zheng T, Nicchitta CV. Hierarchical regulation of mRNA partitioning between the cytoplasm and the endoplasmic reticulum of mammalian cells. Mol. Biol. Cell. 2011;22:2646–2658. - PMC - PubMed

Publication types