. 2012 Jul 20;150(2):327-38.
doi: 10.1016/j.cell.2012.05.037.

Structure of the rigor actin-tropomyosin-myosin complex

Affiliations

Structure of the rigor actin-tropomyosin-myosin complex

Elmar Behrmann et al. Cell. .

Abstract

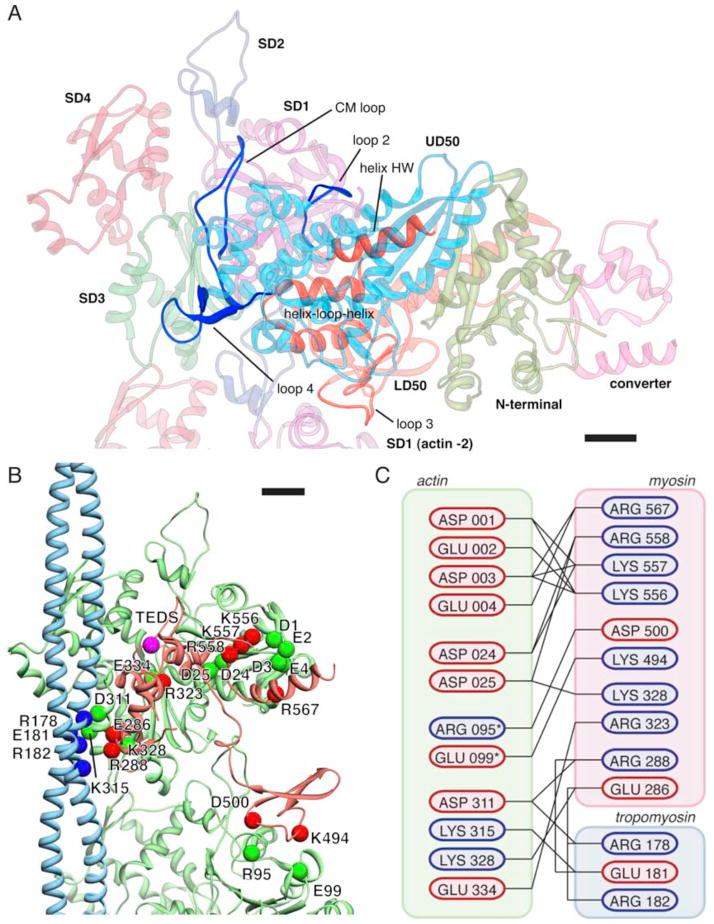
Regulation of myosin and filamentous actin interaction by tropomyosin is a central feature of contractile events in muscle and nonmuscle cells. However, little is known about molecular interactions within the complex and the trajectory of tropomyosin movement between its "open" and "closed" positions on the actin filament. Here, we report the 8 Å resolution structure of the rigor (nucleotide-free) actin-tropomyosin-myosin complex determined by cryo-electron microscopy. The pseudoatomic model of the complex, obtained from fitting crystal structures into the map, defines the large interface involving two adjacent actin monomers and one tropomyosin pseudorepeat per myosin contact. Severe forms of hereditary myopathies are linked to mutations that critically perturb this interface. Myosin binding results in a 23 Å shift of tropomyosin along actin. Complex domain motions occur in myosin, but not in actin. Based on our results, we propose a structural model for the tropomyosin-dependent modulation of myosin binding to actin.


Conflict of interest statement

The authors declare no competing financial interests.

Figures

Figure 1
Figure 1. Cryo electron microscopy of F-actin (undecorated actin) and the complex of F-actin, myosin-IE motor domain and tropomyosin (decorated actin)
(A) Subarea of an unprocessed image of the vitrified sample recorded at a defocus of 1 μm. The presence of a mixture of filament types is evident (decorated filaments marked by white arrows, undecorated filaments marked by black arrows). Filaments appear to be either decorated or undecorated over their complete length. Scale bar, 50 nm. (B) Representative class sums of the decorated filaments (35,374 segments). No classes with partial decoration were identified. Scale bar, 20 nm. (C) Representative class sums of the undecorated filaments (4,629 segments). No classes with partial decoration were identified. Scale bar, 20 nm.
Figure 2
Figure 2. Fit of pseudo-atomic models into the electron density maps of the undecorated F-actin filament and three ATM complex conformers
Electron density maps for (A) the undecorated filament and (B–D) the three decorated filaments (group 1–3). Central subunits are depicted as ribbon traces of the Cα coordinates colored with a rainbow gradient from blue (amino terminus) to red (carboxy terminus). Arrow indicates the Milligan contact. Scale bar, 5 nm.
Figure 3
Figure 3. Analysis of conformational changes induced by complex formation
(A–C) Analysis of the variability of the F-actin models between the undecorated and with myoE and tropomyosin decorated state. (A–B) Atomic models of an undecorated and decorated (group 3) F-actin subunit, respectively. Models are color coded by Cα RMSD values ranging from 0 Å (blue) to 10 Å (red). Major differences are found in carboxy terminal region of the DNase I binding loop (residues 39–52) and the amino terminal region (residues 1–5). (C) Visualization of the first eigenvector obtained after PCA as a trajectory of standard deviation scaled displacements from the average structure. No clear pattern of displacements is discernable. Actin is colored with a rainbow gradient from blue (amino terminus) to red (carboxy terminus). (D–F) Analysis of the variability of the myoE models between pre-power stroke and rigor state. (D–E) Atomic models of pre-power stroke (PDB ID: 1LKX chain C) and rigor state (group 3 myosin) color coded by Cα RMSD values ranging from 0 Å (blue) to 20 Å (red). In the converter domain, displacements ranged up to 40 Å. The second highest displacement locates to the UD50. (F) Visualization of the first eigenvector for myoE. While the LD50, especially the helix-loop-helix motif, is almost invariable, clear changes are seen in all other domains indicating closure of the 50-kDa-cleft and rotation of the converter domain. Myosin is colored with a rainbow gradient from blue (amino terminus) to red (carboxy terminus). (G–H) Eigenvalue spectra for actin PCA and myoE PCA, respectively. While changes upon complex formation cannot easily be accounted for in the case of actin, one eigenvector is enough to account for over 92 % of observed variance in the case of myosin. Scale bar, 1 nm.
Figure 4
Figure 4. The binding interface with potential key electrostatic interactions between myosin, tropomyosin and actin(0) and (−2)
(A) Overview of the binding interface between myosin and actin. Regions on myosin involved in actin binding are highlighted and labeled. (B) Pseudo-atomic model of the complete binding interface. Potential interaction partners with complimentary charges in close proximity are depicted as colored spheres. In addition, the TEDS site (which is not part of the interface) is depicted as a pink sphere. The interface between actin(0) and myosin extends over 1,450 Å2, the interface between actin(−2) and myosin over 370 Å2, the interface between actin(0) and tropomyosin over 210 Å2 and the interface between myosin and tropomyosin over 300 Å2. (C) Cartoon representation of the interface. Residues are colored by charge at pH 7.4. Asterisk denotes residues that are part of the actin (−2) interface. Scale bars, 1 nm.
Figure 5
Figure 5. Tropomyosin in the B and M state
(A) Top views along the filament axis at the three positions indicated by vertical markers in (B). Upon myosin binding, the position of tropomyosin is rotated azimuthally by ca. 30° as indicated by the arrows. The density of F-actin with tropomyosin was calculated at 8 Å resolution based on the tropomyosin model in its B-state. In addition to the rotation, the radial position of tropomyosin is reduced from 43 Å to 40 Å. Scale bar, 5 nm. (B) Side view orthogonal to the filament axis. The vectors defined by the positions of the Cα atoms of two pseudorepeats are depicted as black bars. The angle between the tropomyosin filament and the actin filament remains unchanged upon myosin binding at ~20°. Scale bar, 2.5 nm (C) Overlay of the two states depicted in (B) with actin and myosin faded. Displacement of tropomyosin can be described as a shift along the surface of the actin filament with additional lateral movement. MyoE, tropomyosin and actin are salmon, light green and blue, respectively. Scale bar, 2.5 nm.

References

    1. Lymn RW, Taylor EW. Mechanism of adenosine triphosphate hydrolysis by actomyosin. Biochemistry. 1971;10:4617–4624. - PubMed
    1. Mannherz HG, Leigh JB, Holmes KC, Rosenbaum G. Identification of the transitory complex myosin-ATP by the use of, -methylene-ATP. Nat New Biol. 1973;241:226–229. - PubMed
    1. Sweeney HL, Houdusse A. Structural and functional insights into the Myosin motor mechanism. Annu Rev Biophys. 2010;39:539–557. - PubMed
    1. Houdusse A, Szent-Gyorgyi AG, Cohen C. Three conformational states of scallop myosin S1. Proc Natl Acad Sci U S A. 2000;97:11238–11243. - PMC - PubMed
    1. Coureux PD, Sweeney HL, Houdusse A. Three myosin V structures delineate essential features of chemo-mechanical transduction. Embo J. 2004;23:4527–4537. - PMC - PubMed

Publication types

MeSH terms

LinkOut - more resources