. 2012 Jul 20;150(2):339-50.
doi: 10.1016/j.cell.2012.06.019.

The RIP1/RIP3 necrosome forms a functional amyloid signaling complex required for programmed necrosis

Affiliations

The RIP1/RIP3 necrosome forms a functional amyloid signaling complex required for programmed necrosis

Jixi Li et al. Cell. .

Abstract

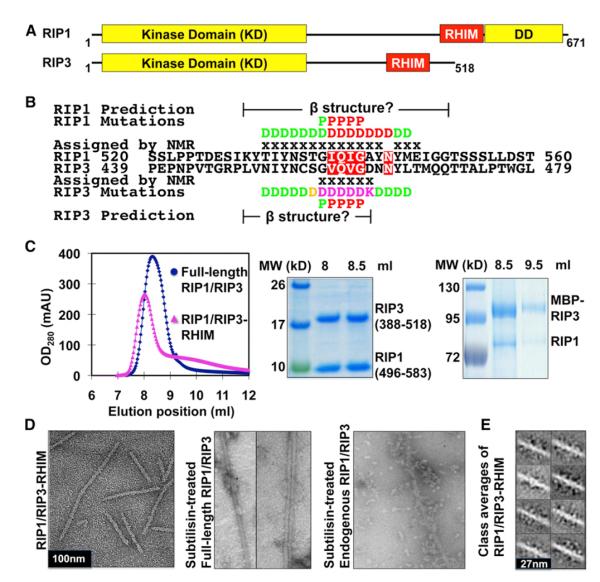
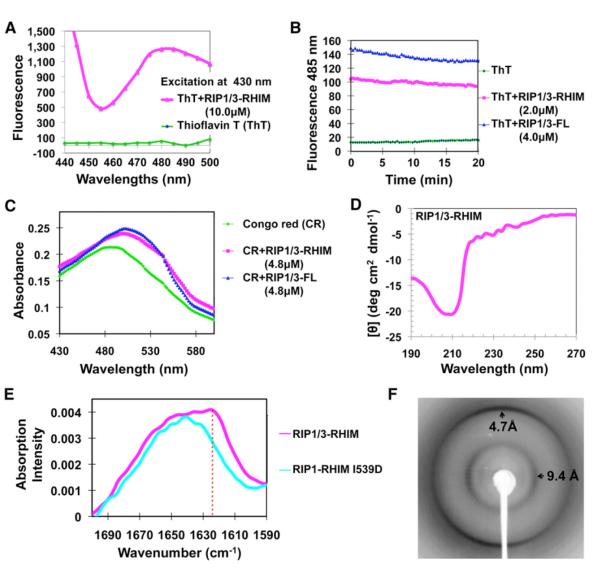
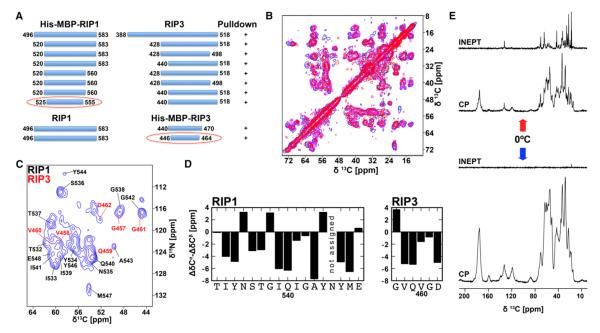
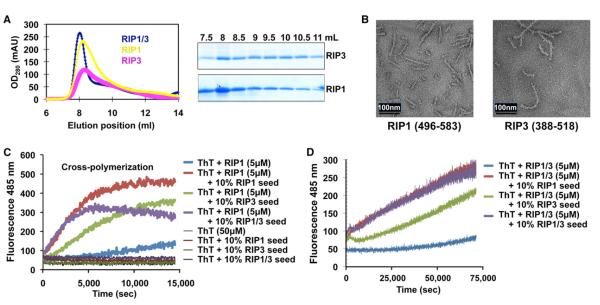
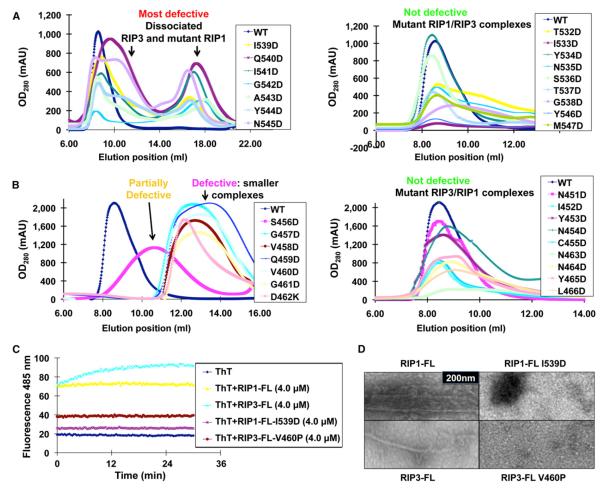
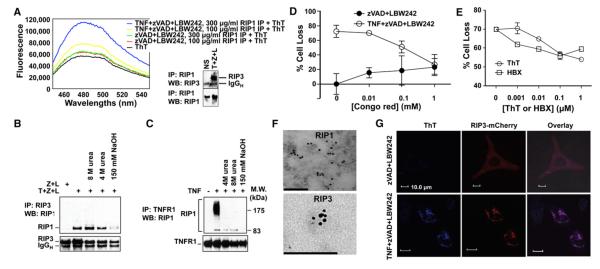
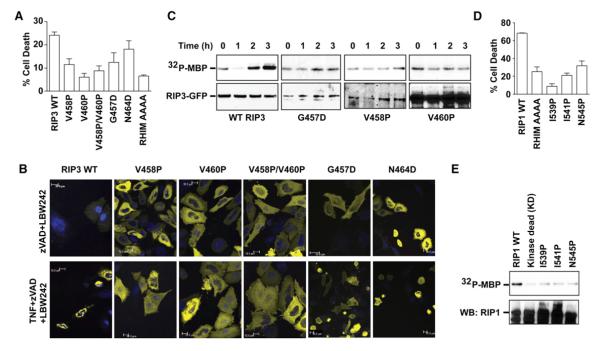
RIP1 and RIP3 kinases are central players in TNF-induced programmed necrosis. Here, we report that the RIP homotypic interaction motifs (RHIMs) of RIP1 and RIP3 mediate the assembly of heterodimeric filamentous structures. The fibrils exhibit classical characteristics of β-amyloids, as shown by Thioflavin T (ThT) and Congo red (CR) binding, circular dichroism, infrared spectroscopy, X-ray diffraction, and solid-state NMR. Structured amyloid cores are mapped in RIP1 and RIP3 that are flanked by regions of mobility. The endogenous RIP1/RIP3 complex isolated from necrotic cells binds ThT, is ultrastable, and has a fibrillar core structure, whereas necrosis is partially inhibited by ThT, CR, and another amyloid dye, HBX. Mutations in the RHIMs of RIP1 and RIP3 that are defective in the interaction compromise cluster formation, kinase activation, and programmed necrosis in vivo. The current study provides insight into the structural changes that occur when RIP kinases are triggered to execute different signaling outcomes and expands the realm of amyloids to complex formation and signaling.


Figures

Figure 1
Figure 1. RIP1 and RIP3 Form a Filamentous Complex In Vitro and in Cells
(A) Domain organization of human RIP1 and RIP3. (B) Sequence alignment of RIP1 and RIP3 around the core RHIMs. Residues in RIP1 and RIP3 that are conserved across different species (Figure S1) are highlighted in red. Regions predicted to be in β sheet conformations are shown. Residues assigned by solid-state NMR are marked with “x.” Summary of mutagenesis results are displayed, with red indicating most defective mutants showing complete or partial dissociation between RIP1 and RIP3, magenta indicating defective mutants showing smaller complexes, orange indicating partially defective mutants with size of the complex between that of WT and defective mutants, and green indicating nondefective mutants. (C) Coexpressed full-length and truncated RIP1/RIP3 complexes. Left, superimposed gel filtration profiles. Right, SDS-PAGE of the fractions. (D) EM images of the RIP1/RIP3 complex. (E) Representative class averages of the RIP1/RIP3-RHIM fibrils. See also Figure S1.
Figure 2
Figure 2. The RIP1/RIP3 Complex Is Amyloidal
(A) Fluorescence emission spectra of ThT in the absence (green) and presence (magenta) of the RIP1/RIP3-RHIM complex. (B) Both the RIP1/RIP3-RHIM and the full-length RIP1/RIP3 complex bind ThT. (C) Absorption spectra of CR in the absence (green) and presence of either RIP1/RIP3-RHIM (magenta) or full-length RIP1/RIP3 complex (blue). (D) Circular dichroism spectrum of the RIP1/RIP3-RHIM complex. (E) Superimposed Fourier transform infrared spectra of RIP/RIP3-RHIM (magenta) and the I539D mutant of RIP1 (cyan). Only the WT RIP1/RIP3 complexes, not the RHIM mutant, showed the amide I’ maxima at 1,623 cm−1 (dashed vertical red line), which is characteristic of β-amyloid. (F) An X-ray diffraction image of partially aligned RIP1/RIP3 fibrils. The arrows indicate equatorial and meridional reflections at 9.4 Å and 4.7 Å resolutions, respectively. See also Figure S2.
Figure 3
Figure 3. The Amyloid Core of the RIP1/RIP3 Complex
(A) Mapping the interaction between RIP1 and RIP3 by using coexpression and His-tag pull-down. The shortest constructs that retained interaction are circled in red. (B) Overlay of 2D DARR 13C-13C solid-state NMR spectra of the RIP1 (residues 496–583)/RIP3 (residues 388–518) complex (blue), its subtilisin-digested counterpart (magenta), and the RIP1 (residues 496–583)/RIP3 (residues 446–518) complex (red). (C) 2D 15N-13C NCA solid-state NMR spectrum of subtilisin-digested RIP1/RIP3 complex. Site-specific assignments are indicated for RIP1 (black) and RIP3 (red). (D) Plot of the difference in secondary chemical shift between Cα and Cβ, indicative of secondary structures (only ΔδCα for Gly). (E) 13C 1D NMR spectra of the RIP1 (residues 496–583)/RIP3 (residues 388–518) complex. At above 0°C (top), the line width is generally narrower, and the INEPT pulse sequence, which is sensitive to relatively dynamic domains of the sample, gives an intense spectrum. At below 0°C (bottom), most of the dynamics are arrested, leading to no signal in the INEPT and an intense and broad cross-polarization (CP) spectrum, which is sensitive to the static domains of the sample. See also Figure S3.
Figure 4
Figure 4. Cross-Polymerization and Mutagenesis of the RIP1/RIP3 Interaction
(A) Left, superimposed gel filtration profiles of the RHIM fragments of RIP1 (residues 496–583), RIP3 (residues 388–518), and the RIP1/RIP3 complex. Right, SDS-PAGE of gel filtration fractions of RIP1 and RIP3. (B) EM images of RIP1 and RIP3. (C and D) Cross-seeding in the polymerization of denatured RIP1 and the denatured RIP1/RIP3 complex by using ThT binding assays, respectively. See also Figure S4.
Figure 5
Figure 5. Mutagenesis of RIP1 and RIP3
(A) Superimposed gel filtration profiles of complexes of mutant RIP1 and WT RIP3. Left, RIP1 mutants that dissociated from RIP3; right, RIP1 mutants that did not dissociate from RIP3 and migrated near the void position. (B) Superimposed gel filtration profiles of complexes of mutant RIP3 and WT RIP1. Left, complexes of mutant RIP3 and WT RIP1 that migrated later than the void position; right, complexes of mutant RIP3 and WT RIP1 that migrated near the void position. (C) ThT fluorescence of WT and mutant full-length RIP1 and RIP3. (D) EM images of negatively stained WT and mutant full-length RIP1 and RIP3. See also Figure S5.
Figure 6
Figure 6. RIP1 and RIP3 Form Amyloidal Clusters In Vivo during Programmed Necrosis
(A) Endogenous RIP1-containing complexes from necrotic HT-29 cells bind ThT. The right panel shows the specific pull-down of RIP3 by RIP1 upon TNF, zVADfmk, and LBW242 stimulation (T+Z+L). (B) RIP3 complexes isolated by immunoprecipitation from HT-29 cells treated with T+Z+L after lysis in regular lysis buffer or buffer containing the indicated amount of urea or NaOH. (C) TNFR1 complexes isolated by immunoprecipitation from MEFs treated with TNF after lysis in regular lysis buffer or buffer containing the indicated amount of urea or NaOH. (D and E) Amyloid-binding compounds inhibit TNF-induced necrosis in HT-29 cells. Results shown are averages of triplicates ±SEM. (F) Clustering of RIP1 and RIP3 in necrotic MEFs shown by immunogold EM. Scale bars, 200 nm (RIP1) and 100 nm (RIP3). (G) Costaining of ThT with RIP3 puncta in necrotic HeLa cells as visualized by confocal microscopy. See also Figure S6.
Figure 7
Figure 7. The RIP1/RIP3 Interaction Is Crucial for Kinase Activation, Clustering, and Cell Death
(A) Effects of RIP3 mutations on TNF-induced necrosis in HeLa cells transfected with WTor the indicated RIP3 mutants fused to YFP. AAAA, quadruple Ala mutant of RIP3 at the VQVG RHIM sequence. Results shown are averages of triplicates ±SEM. (B) Effects of RIP3 mutations on puncta formation in HeLa cells transfected with the indicated RIP3-YFP plasmids as examined by confocal microscopy. (C) Effects of RIP3 mutations on kinase activity of the anti-RIP3 immunoprecipitates in RIP3−/− fibroblasts stably expressing the indicated RIP3-GFP mutants using MBP as the substrate. Bottom panel shows the RIP3 western blot of the same membrane. (D) Effects of RIP1 mutations on TNF-induced necrosis in RIP1−/− fibroblasts transfected with the indicated RIP1 fused to GFP. Results shown are averages of triplicates ±SEM. (E) Effects of RIP1 mutations on kinase activity of the anti-GFP immunoprecipitates in 293T cells transfected with the indicated RIP1-GFP constructs using MBP as the substrate. The same membrane was probed for RIP1 on western blot in the lower panel. See also Figure S7.

Comment in

  • Cell signalling: A necrosome build-up.
    Papatriantafyllou M. Papatriantafyllou M. Nat Rev Mol Cell Biol. 2012 Sep;13(9):540. doi: 10.1038/nrm3415. Epub 2012 Aug 1. Nat Rev Mol Cell Biol. 2012. PMID: 22850818 No abstract available.
  • Amyloids as kinase signalling platforms.
    Sun L. Sun L. Nat Rev Mol Cell Biol. 2023 Feb;24(2):85. doi: 10.1038/s41580-022-00553-z. Nat Rev Mol Cell Biol. 2023. PMID: 36266548 No abstract available.

References

    1. Alavez S, Vantipalli MC, Zucker DJ, Klang IM, Lithgow GJ. Amyloid-binding compounds maintain protein homeostasis during ageing and extend lifespan. Nature. 2011;472:226–229. - PMC - PubMed
    1. Avila J, Gómez de Barreda E, Engel T, Lucas JJ, Hernández F. Tau phosphorylation in hippocampus results in toxic gain-of-function. Biochem. Soc. Trans. 2010;38:977–980. - PubMed
    1. Balbirnie M, Grothe R, Eisenberg DS. An amyloid-forming peptide from the yeast prion Sup35 reveals a dehydrated beta-sheet structure for amyloid. Proc. Natl. Acad. Sci. USA. 2001;98:2375–2380. - PMC - PubMed
    1. Challa S, Woelfel M, Guildford M, Moquin D, Chan FK. Viral cell death inhibitor MC159 enhances innate immunity against vaccinia virus infection. J. Virol. 2010;84:10467–10476. - PMC - PubMed
    1. Chan FK, Shisler J, Bixby JG, Felices M, Zheng L, Appel M, Orenstein J, Moss B, Lenardo MJ. A role for tumor necrosis factor receptor-2 and receptor-interacting protein in programmed necrosis and antiviral responses. J. Biol. Chem. 2003;278:51613–51621. - PubMed

Publication types

MeSH terms

Substances