. 2012 Jul 20;150(2):402-12.
doi: 10.1016/j.cell.2012.06.030.

Genome-wide single-cell analysis of recombination activity and de novo mutation rates in human sperm

Affiliations

Genome-wide single-cell analysis of recombination activity and de novo mutation rates in human sperm

Jianbin Wang et al. Cell. .

Abstract

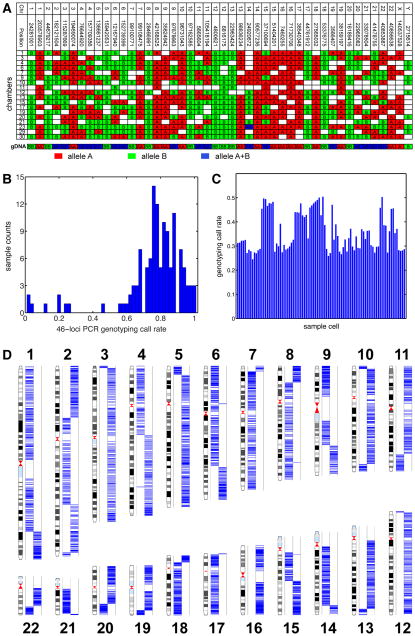
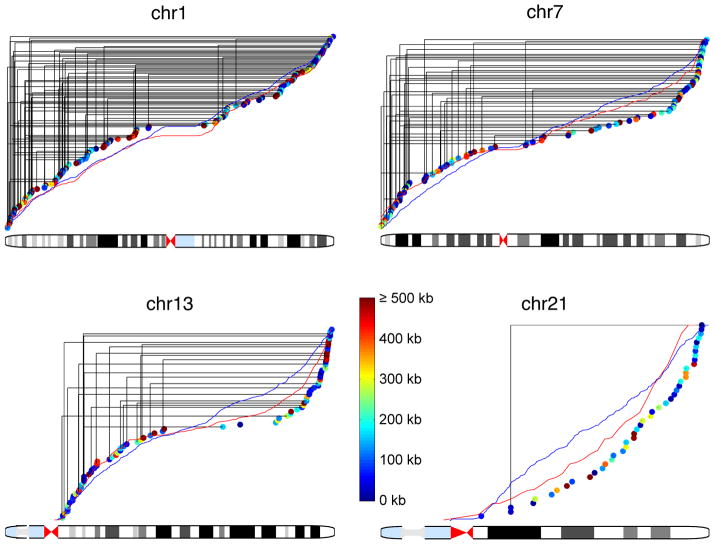
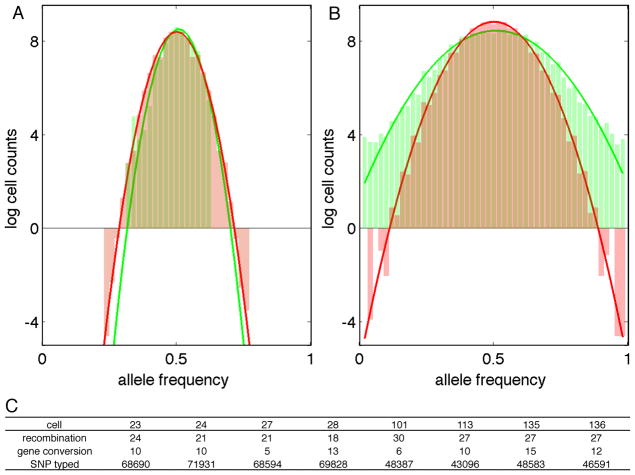
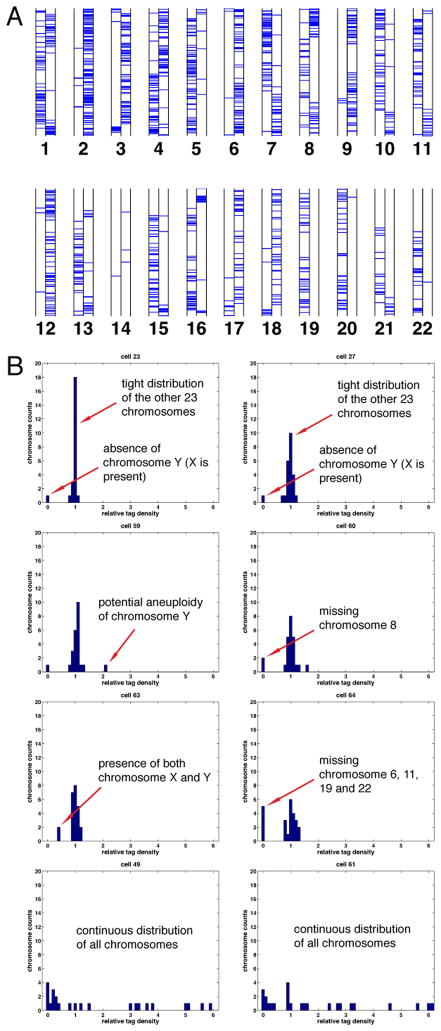
Meiotic recombination and de novo mutation are the two main contributions toward gamete genome diversity, and many questions remain about how an individual human's genome is edited by these two processes. Here, we describe a high-throughput method for single-cell whole-genome analysis that was used to measure the genomic diversity in one individual's gamete genomes. A microfluidic system was used for highly parallel sample processing and to minimize nonspecific amplification. High-density genotyping results from 91 single cells were used to create a personal recombination map, which was consistent with population-wide data at low resolution but revealed significant differences from pedigree data at higher resolution. We used the data to test for meiotic drive and found evidence for gene conversion. High-throughput sequencing on 31 single cells was used to measure the frequency of large-scale genome instability, and deeper sequencing of eight single cells revealed de novo mutation rates with distinct characteristics.


Figures

Figure 1
Figure 1
Microfluidic device designed for the whole genome amplification from single sperm cells. Device layout and operation pipeline are slightly modified from a similar device used to measure haplotype. A single sperm cell highlighted by the red square is recognized microscopically and captured in the cross region. In the overview image of the device, control channels are filled with green dye, and flow channels are filled with red dye. See also Table S1.
Figure 2
Figure 2
Whole-genome single sperm typing. (A) Evaluation of amplification performance using 46-loci PCR. This table represents results from a subset of sperm cells being amplified. Each row represents the content from a microfluidic chamber, and each column represents a locus, with specified chromosome number and coordination (NCBI b36). The genotypes of genomic DNA control are also shown. The two alleles of a SNP are highlighted in red and green. Heterozygous loci are labeled in blue. Sample 11 shows a genotyping profile similar to no-template WGA control, indicating mis-identification of sperm cell before amplification. Sample 23 shows heterozygous genotype on chromosome 14 and sex chromosome, suggesting multiple cells during amplification. (B) 46-loci PCR genotyping call rates. (C) Whole genome genotyping call rates of 91 single sperm samples from Illumina HumanOmni1S Bead Array. (D) Detection of recombination from a single sperm sample. The two columns in each chromosome represent the two somatic haplotypes, and blue lines show the genotyping calls of heterozygous SNPs from the sample. Each switch of haplotype block indicates a recombination event. See also Table S2.
Figure 3
Figure 3
Recombination map from chromosome 1, 7, 13 and 21. Each dot represents a recombination event with color code for resolution. Solid black lines connect recombination events from the same sperm cell. Red and blue lines show the cumulative recombination rates from deCODE (male) and HapMap, respectively. See also Figure S1 and Table S3.
Figure 4
Figure 4
Meiotic drive and gene conversion. Allele frequency histograms of 100-kb haplotype blocks (A) and individual heterozygous SNP (B). Green columns represent experiment data and red columns represent simulation results assuming no transmission distortion. Solid lines are normal distribution fitting results in log scale. (C) Gene conversion statistics of single cells. See also Table S4.
Figure 5
Figure 5
Germline genome instability. (A) Whole-genome genotyping results of cell 112. Two columns in each chromosome represent the two haplotypes and each horizontal bar shows the genotype of a SNP. Chromosome 14 showed very low call rates, suggesting its complete deletion. (B) Cell 23 and 27 are shown as normal controls, with 23 chromosomes clustered by normalized tag density and one sex chromosome dropped. Cells 59, 60, 63 and 64 had whole chromosome aneuploidy. Cell 49 and 61 displayed complex, continuous distributions of chromosome representation. See also Figure S3.

References

    1. Ashley EA, Butte AJ, Wheeler MT, Chen R, Klein TE, Dewey FE, Dudley JT, Ormond KE, Pavlovic A, Morgan AA, et al. Clinical assessment incorporating a personal genome. The Lancet. 2010;375:1525–1535. - PMC - PubMed
    1. Baudat F, Buard J, Grey C, Fledel-Alon A, Ober C, Przeworski M, Coop G, de Massy B. PRDM9 Is a Major Determinant of Meiotic Recombination Hotspots in Humans and Mice. Science. 2010;327:836–840. - PMC - PubMed
    1. Blainey PC, Quake SR. Digital MDA for enumeration of total nucleic acid contamination. Nucleic Acids Research 2010 - PMC - PubMed
    1. Cheung VG, Burdick JT, Hirschmann D, Morley M. Polymorphic Variation in Human Meiotic Recombination. American journal of human genetics. 2007;80:526–530. - PMC - PubMed
    1. Conrad DF, Keebler JEM, DePristo MA, Lindsay SJ, Zhang Y, Casals F, Idaghdour Y, Hartl CL, Torroja C, Garimella KV, et al. Variation in genome-wide mutation rates within and between human families. Nat Genet. 2011;43:712–714. - PMC - PubMed

Publication types