. 2012 Oct;6(5):507-15.
doi: 10.1016/j.molonc.2012.06.005. Epub 2012 Jul 5.

Activation of androgen receptor induces ID1 and promotes hepatocellular carcinoma cell migration and invasion

Affiliations

Activation of androgen receptor induces ID1 and promotes hepatocellular carcinoma cell migration and invasion

Junping Ao et al. Mol Oncol. 2012 Oct.

Abstract

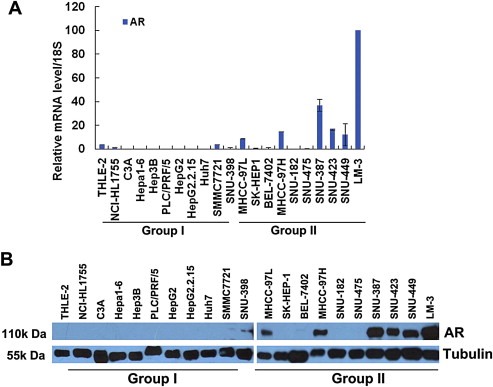
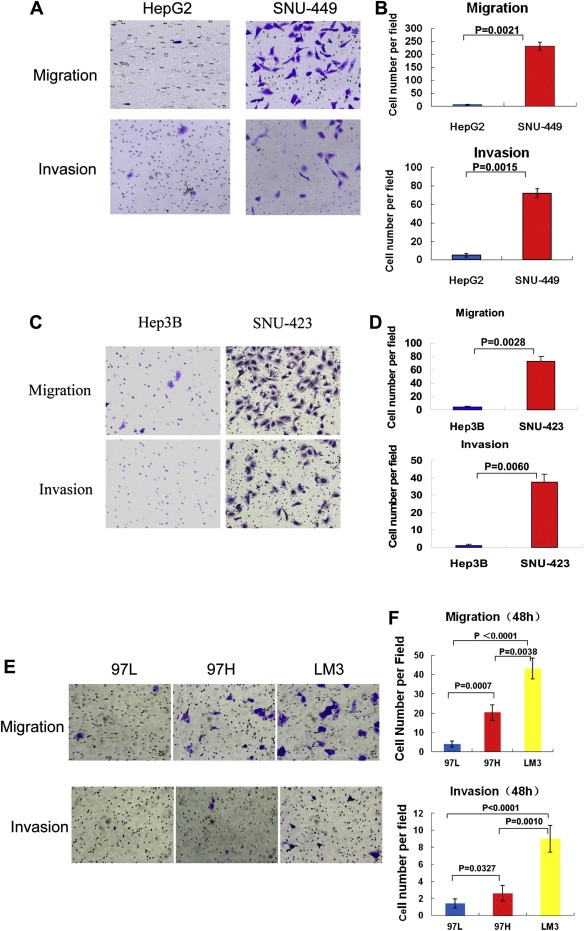
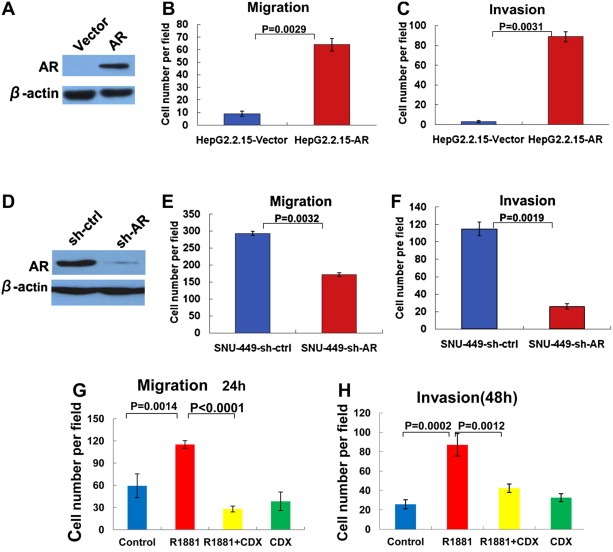
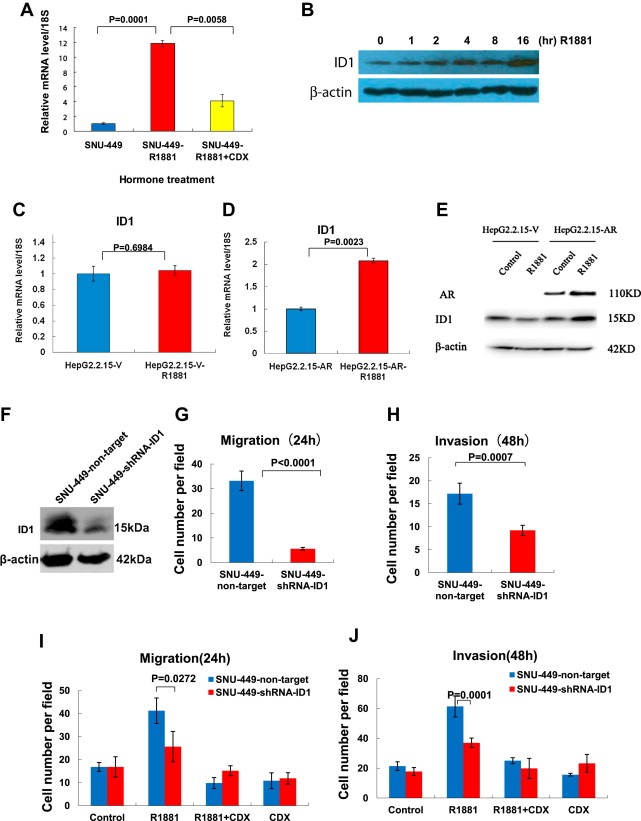
Androgen receptor (AR) activity is associated with cancer development and progression. In hepatocellular carcinoma (HCC), AR contributes to HCC incidence, but the role of AR in HCC cell migration and invasion remains largely unknown. In this study, we found that AR was expressed at high levels in a subgroup of HCC cell lines with high metastatic potential. Experiments using lentiviral overexpression or small hairpin RNA knockdown of AR as well as activation of AR by its ligand indicated that AR activation promoted HCC cell migration and invasion. We also found that AR activation enhanced the expression of a metastasis-promoting gene, ID1, which led to increased HCC cell migration and invasion. An AR antagonist was able to block this process, suggesting that AR activation in AR-positive HCC may be therapeutically inhibited as a potential intervention strategy.


Figures

Figure 1
Figure 1
High AR mRNA and protein expression levels in HCC cell lines correlated with high cell metastatic potential. (A) AR mRNA levels in 20 HCC cell lines. AR mRNA levels in each HCC cell line and the normal liver cell line THLE‐2 were evaluated using real‐time RT‐PCR analysis as indicated, and data values were normalized to 18S RNA. Group I and Group II are indicated with low or high metastatic potential, respectively. (B) High AR protein expression levels in 20 HCC cell lines correlated with cell metastatic potential. AR protein expression levels in each HCC cell line and the normal liver cell line THLE‐2 were evaluated using Western blot analysis as indicated. Tubulin served as a loading control.
Figure 2
Figure 2
HCC cells with higher AR expression levels had higher cell migration and invasion rates. (A) AR‐positive HCC cell line SNU‐449 had higher migration and invasion rates than AR‐negative cell line HepG2. Transwell cell migration and invasion assays were performed as described in Methods and Materials. Representative cell pictures are shown. (B) Counted cell numbers of the experiment in (A) are shown. Error bars indicate means ± SDs. (C) AR‐positive HCC cell line SNU‐423 had higher migration and invasion rates than AR‐negative cell line Hep3B. Transwell cell migration and invasion assays were performed as described above. (D) Counted cell numbers of the experiment in (C) are shown. Error bars indicate means ± SDs. (E) The higher levels of AR, the higher migration and invasion rates of the HCC cells: 97L < 97H < LM3. Same experiments were performed as in (A) except using MHCC‐97L (97L), MHCC‐97H (97H) and LM‐3 (LM3) cells. (F) Counted cell numbers of the experiment in (E) are shown. Error bars indicate means ± SDs.
Figure 3
Figure 3
Ectopic expression of AR or activation of AR by androgen, and shRNA knockdown of AR increased and decreased HCC cell migration and invasion, respectively. (A) Ectopic expression of AR in HepG2.2.15 cells. Western blot analysis of AR expression in HepG2.2.15 cells infected by the lentivirus vector as a control (Vector) or the lentivirus expressing AR (AR) using each antibody as indicated. Beta actin served as a loading control. (B) (C) Ectopic expression of AR in HepG2.2.15 cells (HepG2.2.15‐AR) increased cell migration and invasion. Transwell cell migration (B) and invasion (C) assays were performed as described previously. Quantitative cell numbers are shown. HepG2.2.15 cells infected by an empty lentiviral vector (HepG2.2.15‐Vector) served as a control. (D) shRNA knockdown of AR in SNU‐449 cells. Western blot analysis of AR expression in SNU‐449 cells infected by the lentivirus vector as a control (sh‐ctrl) or the lentivirus expressing shRNA against AR (sh‐AR). Beta actin served as a loading control. (E) (F) shRNA knockdown of AR in SNU‐449 cells (SNU‐449‐sh‐AR) decreased cell migration and invasion. Transwell cell migration (E) and invasion (F) assays were performed as described in Methods and Materials. SNU‐449 cells infected by an empty lentiviral vector (SNU‐449‐sh‐ctrl) served as a control. Quantitative cell numbers are shown. (G) Androgen agonist R1881 increased SNU‐449 cell migration. SNU‐449 cells were cultured in 10% charcoal‐stripped serum media for 3 days and then treated with hormone R1881 (10−8 M) (R1881) for 16 h followed by transwell cell migration. Cells treated with vehicle DMSO served as a control (Control). Androgen antagonist CDX alone (CDX) or in combination with R1881 (R1881 + CDX) was used in the experiments to block androgen activation. Cell numbers were counted from five random fields in the experiment. Error bars indicate means ± SDs. (H) Androgen agonist R1881 increased SNU‐449 cell invasion. Similar experiments as in (G) except that cell invasion assays were performed.
Figure 4
Figure 4
Activation of AR by androgen stimulated expression of the metastasis‐promoting gene ID1, and shRNA knockdown of ID1 attenuated androgen‐stimulated cell migration and invasion. (A) Androgen agonist R1881 stimulated ID1 mRNA expression in SUN‐449 cells. SNU‐449 cells were cultured in 10% charcoal‐stripped serum media for 3 days and then treated with hormone R1881 (10−8 M) for 16 h (SNU‐449‐R1881) followed by RNA isolation and real‐time RT‐PCR analysis of ID1. Vehicle treatment (SNU‐449) served as a control. Androgen antagonist CDX was included in experiments to block androgen activation (SNU‐449‐R1881 + CDX). 18S was used for normalization of mRNA levels. Error bars indicate means ± SDs. (B) R1881 induced ID1 protein levels. Time‐course experiment was performed in a manner similar to (A) above followed by Western blot analysis using indicated antibodies. (C) (D) R1881‐stimulated ID1 mRNA expression depended on the presence of AR. (C) AR‐negative HepG2.2.15 cells infected with the lentiviral‐empty‐vector (HepG2.2.15‐V) were analyzed for ID1 mRNA levels by real time RT‐PCR after treatment with hormone R1881 for 16 h (HepG2.2.15‐V‐R1881). (D) HepG2.2.15 cells infected with the lentiviral‐AR (HepG2.2.15‐AR) were analyzed for ID1 mRNA levels by real time RT‐PCR after treatment with hormone R1881 for 16 h (HepG2.2.15‐AR‐R1881). 18S was used for normalization of mRNA levels. Error bars indicate means ± SDs. P < 0.05 was considered significant. (E) Western blot analysis of AR and ID1 expression in (C) and (D) above. (F) (G) (H) shRNA knockdown of ID1 decreased SNU‐449 cell migration and invasion. (F) Western blot analysis of shRNA knockdown of ID1 in SNU‐449 cells. Lentiviral shRNA for non‐targeting control (SNU‐449‐non‐target) or for ID1 (SNU‐449‐shRNA‐ID1) were used to knockdown ID1 in SNU‐449 cells. Western blot analysis was performed by using the indicated antibodies. (G) shRNA knockdown of ID1 decreased SNU‐449 cell migration. Transwell migration and invasion assays were performed using the SNU‐449 cells in (F). Cell numbers were counted and shown. Error bars indicate means ± SDs. (H) shRNA knockdown of ID1 decreased SNU‐449 cell invasion. Similar experiment as in (G) above except invasion assays was performed. (I) shRNA knockdown of ID1 attenuated androgen‐stimulated cell migration. shRNA non‐targeting control SNU‐449 cells (SNU‐449‐non‐target) or shRNA ID1‐targeting SNU‐449 cells (SNU449‐shRNA‐ID1) were treated R1881 and/or CDX as indicated, followed by cell migration assays. Quantitative cell numbers are shown. Error bars indicate means ± SDs. (J) shRNA knockdown of ID1 attenuated androgen‐stimulated cell invasion. Experiments for cell invasion assays were performed in a fashion similar to those in (I) above. Error bars indicate means ± SDs.

References

    1. Groupe d'Etude et de Traitement du Carcinome H'epatocellulaire (GRETCH), 2004. Randomized trial of leuprorelin and flutamide in male patients with hepatocellular carcinoma treated with tamoxifen. Hepatology. 40, (6) 1361–1369. - PubMed
    1. Abelev, G.I. , Eraiser, T.L. , 1999. Cellular aspects of alpha-fetoprotein reexpression in tumors. Semin. Cancer Biol.. 9, (2) 95–107. - PubMed
    1. Chiu, C.M. , Yeh, S.H. , 2007. Hepatitis B virus X protein enhances androgen receptor-responsive gene expression depending on androgen level. Proc. Natl. Acad. Sci. USA. 104, (8) 2571–2578. - PMC - PubMed
    1. Ciarrocchi, A. , Piana, S. , 2011. Inhibitor of DNA binding-1 induces mesenchymal features and promotes invasiveness in thyroid tumour cells. Eur. J. Cancer. 47, (6) 934–945. - PubMed
    1. De Maria, N. , Manno, M. , 2002. Sex hormones and liver cancer. Mol. Cell Endocrinol.. 193, (1–2) 59–63. - PubMed

Publication types

MeSH terms