. 2012 Aug 16;488(7411):375-8.
doi: 10.1038/nature11291.

A biophysical signature of network affiliation and sensory processing in mitral cells

Affiliations

A biophysical signature of network affiliation and sensory processing in mitral cells

Kamilla Angelo et al. Nature. .

Abstract

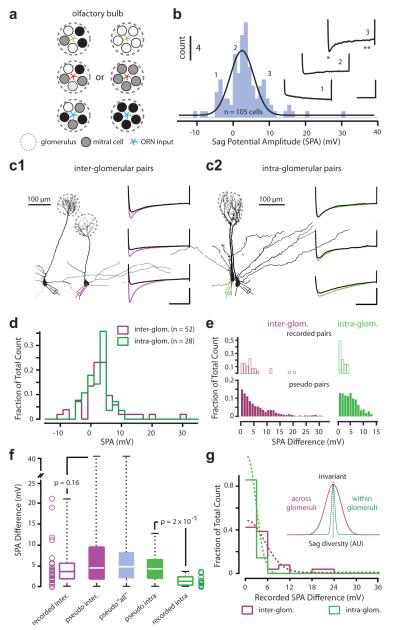
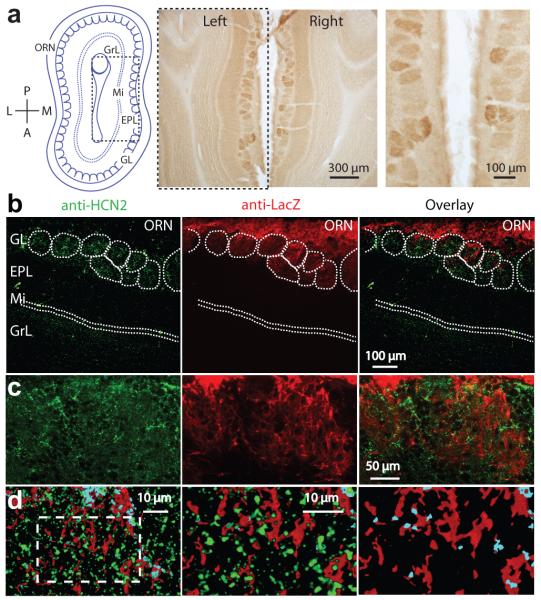
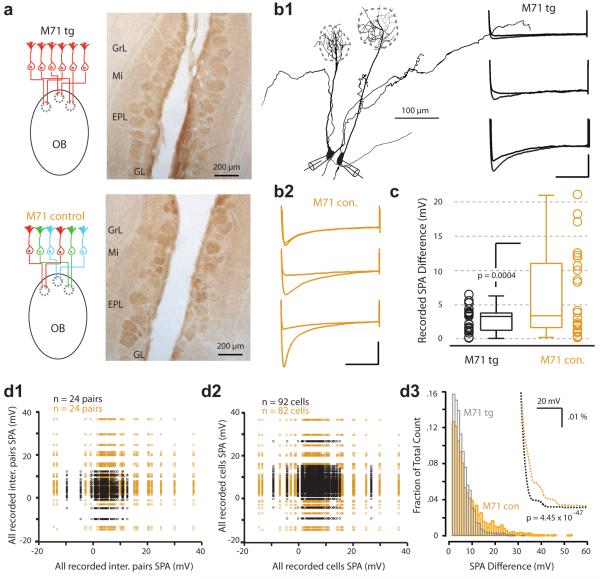
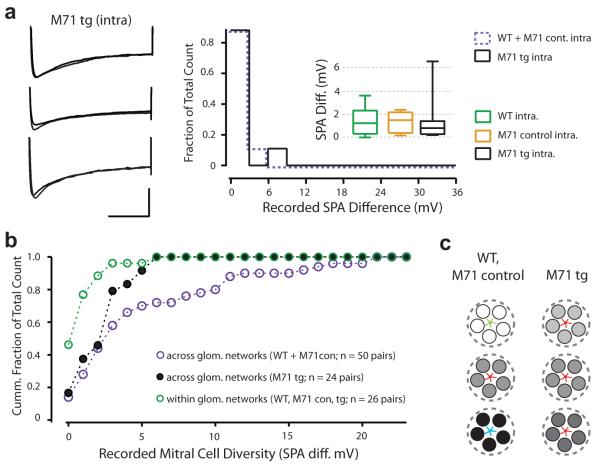
One defining characteristic of the mammalian brain is its neuronal diversity. For a given region, substructure, layer or even cell type, variability in neuronal morphology and connectivity persists. Although it is well known that such cellular properties vary considerably according to neuronal type, the substantial biophysical diversity of neurons of the same morphological class is typically averaged out and ignored. Here we show that the amplitude of hyperpolarization-evoked sag of membrane potential recorded in olfactory bulb mitral cells is an emergent, homotypic property of local networks and sensory information processing. Simultaneous whole-cell recordings from pairs of cells show that the amount of hyperpolarization-evoked sag potential and current (Ih) is stereotypic for mitral cells belonging to the same glomerular circuit. This is corroborated by a mosaic, glomerulus-based pattern of expression of the HCN2 (hyperpolarization-activated cyclic nucleotide-gated channel 2) subunit of the Ih channel. Furthermore, inter-glomerular differences in both membrane potential sag and HCN2 protein are diminished when sensory input to glomeruli is genetically and globally altered so that only one type of odorant receptor is universally expressed. Population diversity in this intrinsic property therefore reflects differential expression between local mitral cell networks processing distinct odour-related information.


Figures

Figure 1
Figure 1. Diversity of sag potential amplitudes within and across mitral cell networks
a) Schematic of two possible organizing principles of mitral cell biophysical diversity. Each olfactory glomerulus receives genetically unique input, indicated in red, green and blue. The intrinsic, biophysical properties of mitral cells (represented by the different colored circles) within a glomerular network may be heterogeneous (left) or homogenous (right). b) Histogram (fitted with a Gaussian) showing the distribution of sag potential amplitude (SPA) recorded across the mitral cell population (n = 105 cells). Traces are three examples recorded from cells belonging to the indicated bins. Scale bar is 600 ms and 15 mV. Example morphologies of two simultaneously recorded mitral cells projecting to either different (c1) or the same glomerular networks (c2). The voltage traces show the sag potential recorded in three examples of inter- and intra-glomerular pairs. Scale bar is 500 ms and 10 mV. d) Histograms of SPA for all individual cells belonging to either inter- (purple) and intra-glomerular (green) pairs. e) top: Histograms of recorded SPA differences for inter- (n = 26) and intra-glomerular (n = 14) pairs. bottom: Histograms of SPA differences for inter- and intra-glomerular pseudo pairs. f) Boxplot of recorded and pseudo inter-glomerular pairs, pseudo-pairs of all recordings, intra-glomerular pseudo- and recorded pairs. Open circles represent individual data points of recorded SPA difference. g) Histogram of sag amplitude difference for inter- and intra-glomerular recorded pairs fitted with a half Gaussian (n = 26 and 14 pairs respectively; bin size = 3 mV). Inset: Gaussian fits of the recorded data for intra-glomerular (green) and inter-glomerular pairs.
Figure 2
Figure 2. Glomerular expression of HCN2 in wild-type and OMP-IRES-tau-LacZ- expressing mice
a) Left: Schematic of a horizontal section of olfactory bulb highlighting its anatomical organization (olfactory receptor nerve (ORN) layer, glomerular layer (GL), mitral cell layer (Mi), external plexiform layer (EPL), granule cell layer (GrL)). Middle, right, HCN2-DAB staining highlighting glomerular diversity. b) Anti-HCN2 and anti-β-galactosidase staining in OMP-IRES-tau-LacZ-expressing mice. Right: Overlay of green and red channels. c) High magnification images of the glomerular layer. Colors as in b. d) Left: Higher magnification images scanned as 30 digital sections represented as a pseudo 3D image of an approximately 6 μm thick section. Areas of overlap between green and red shown as light blue and indicate close proximity of the HCN2 and OMP-LacZ signals (middle and right panels are zoomed images of hashed area shown on left). Right panel: green removed for clarity.
Figure 3
Figure 3. Glomerular expression of HCN2 and mitral cell sag in M71 monoclonal mice
a) Schematic (left) showing that, in the M71tg mouse line, sensory afferents to all glomeruli express the same M71 receptor. On the right, HCN2-DAB stain in horizontal slices from a M71tg mouse. b1) Example morphologies of two simultaneously recorded mitral cells belonging to distinctly different glomeruli (inter-glom pair) in the M71 transgenic. The voltage traces show the sag potential recorded in three different example pairs in M71tg (b1) and control mice (b2). Scale bar is 10 mV, 500 ms. c) Box plot of the SPA difference for inter-glomerular recorded pairs from M71tg (black) and control mice (orange). Scatterplots of SPA for pseudo pairs extracted from paired inter-glomerular recordings in the M71tg (d1) and control (d2) mice. d3) Histogram of SPA differences for pseudo-pairs extracted from all cells recorded in the M71tg (n = 91 cells, 4095 comparisons) and control mice (n = 81 cells, 3321 comparisons; bin size = 1 mV). Inset: Overlay of histogram spline fits highlight the disparity between the distributions.
Figure 4
Figure 4. Population diversity reflects local network membership and sensory processing
a) Left: Example membrane voltage traces showing the sag potential recorded in three different intra-glomerular pairs recorded in the M71 transgenic mouse (scale bar is 500 ms and 10 mV). Right: histogram of the SPA difference recorded for intra-glomerular pairs in mice expressing the M71 transgene (n = 9 pairs; black filled line) versus M71 control and wild-type (pooled: n = 17 pairs; purple dashed line). Inset: Box plot of SPA difference for intra-glomerular pairs recorded in wild-type (n = 14), M71 control (n = 3) and transgenic (n = 9) mice. b) Summary data plotted as a cumulative histogram of SPA difference of all recorded pairs. c) Schematic highlighting the relationship between glomerulus affiliation, sensory input and mitral cell sag diversity (represented by white, grey or black filled circles for wild-type and M71 control mice versus M71tg mice (shades of gray)).

Comment in

References

    1. Gupta A, Wang Y, Markram H. Organizing principles for a diversity of GABAergic interneurons and synapses in the neocortex. Science. 2000;287:273–278. - PubMed
    1. Brochtrup A, Hummel T. Olfactory map formation in the Drosophila brain: genetic specificity and neuronal variability. Curr Opin Neurobiol. 2011;21:85–92. - PubMed
    1. Reyes A, et al. Target-cell specific facilitation and depression in neocortical networks. Nature Neuroscience. 1998;1:279–285. - PubMed
    1. Jinno S, et al. Neuronal diversity in GABAergic long-range projections from the hippocampus. J Neurosci. 2007;27:8790–8804. - PMC - PubMed
    1. Brown SP, Hestrin S. Intracortical circuits of pyramidal neurons reflect their long-range axonal targets. Nature. 2009;457:1133–1136. - PMC - PubMed

Publication types

Substances