. 2012 Aug;122(8):2871-83.
doi: 10.1172/JCI63539. Epub 2012 Jul 23.

Essential metabolic, anti-inflammatory, and anti-tumorigenic functions of miR-122 in liver

Affiliations

Essential metabolic, anti-inflammatory, and anti-tumorigenic functions of miR-122 in liver

Shu-Hao Hsu et al. J Clin Invest. 2012 Aug.

Abstract

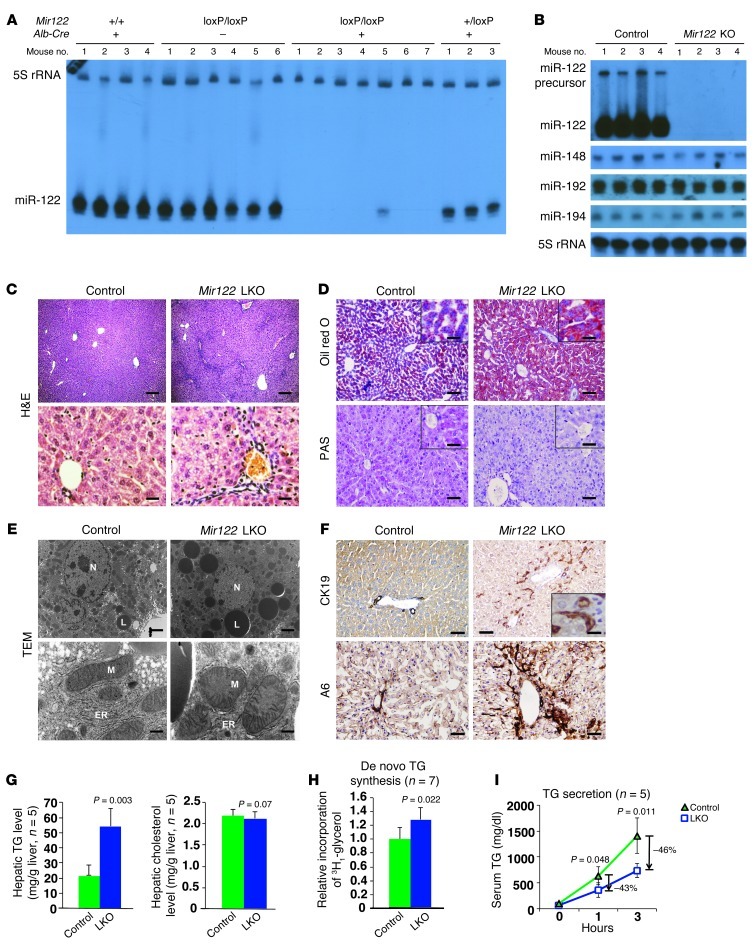
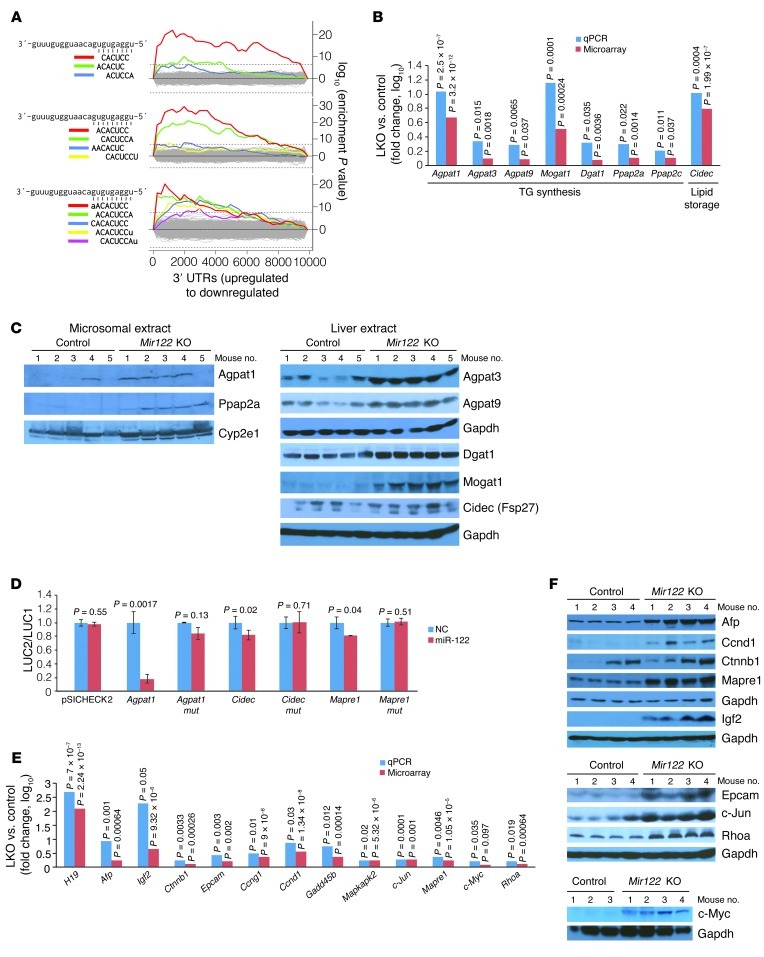
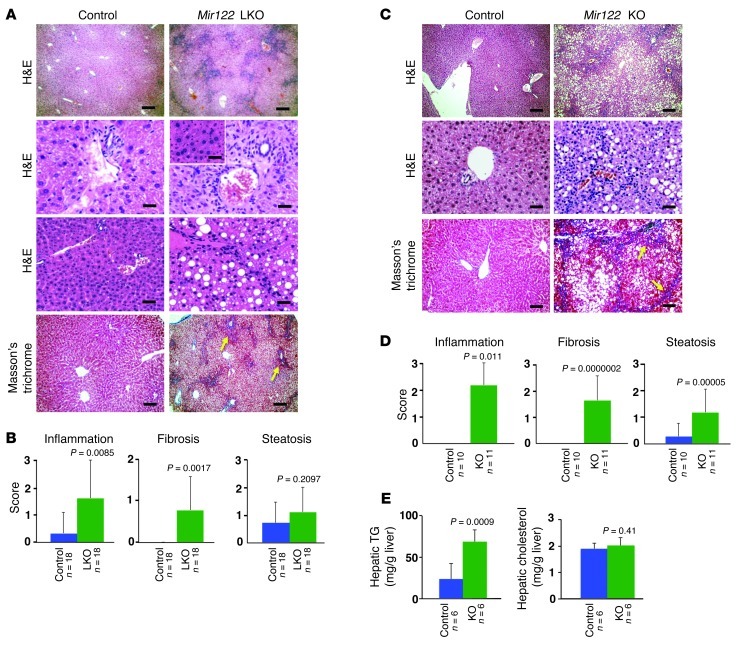
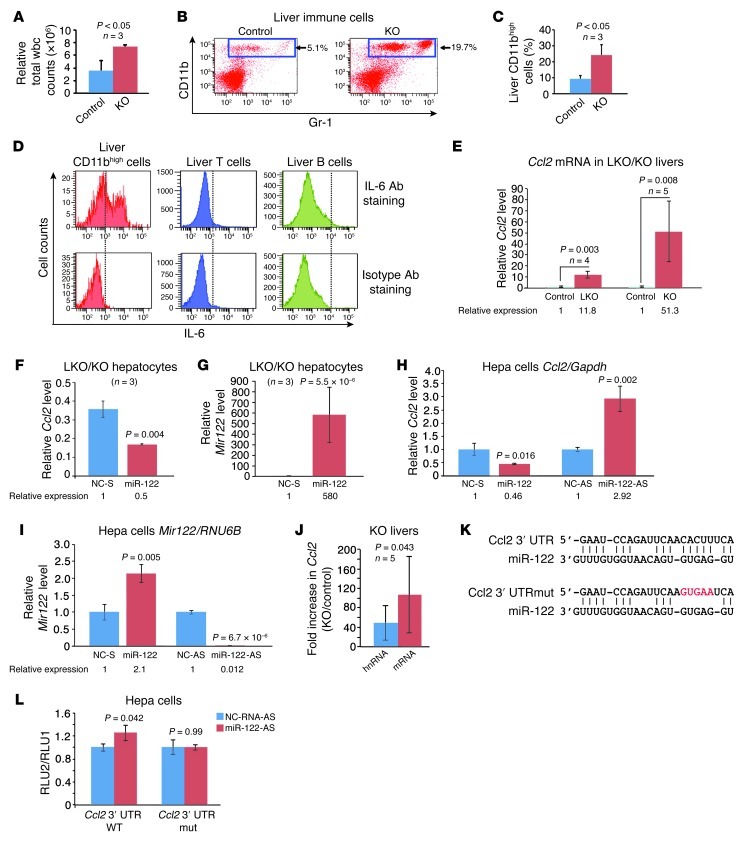
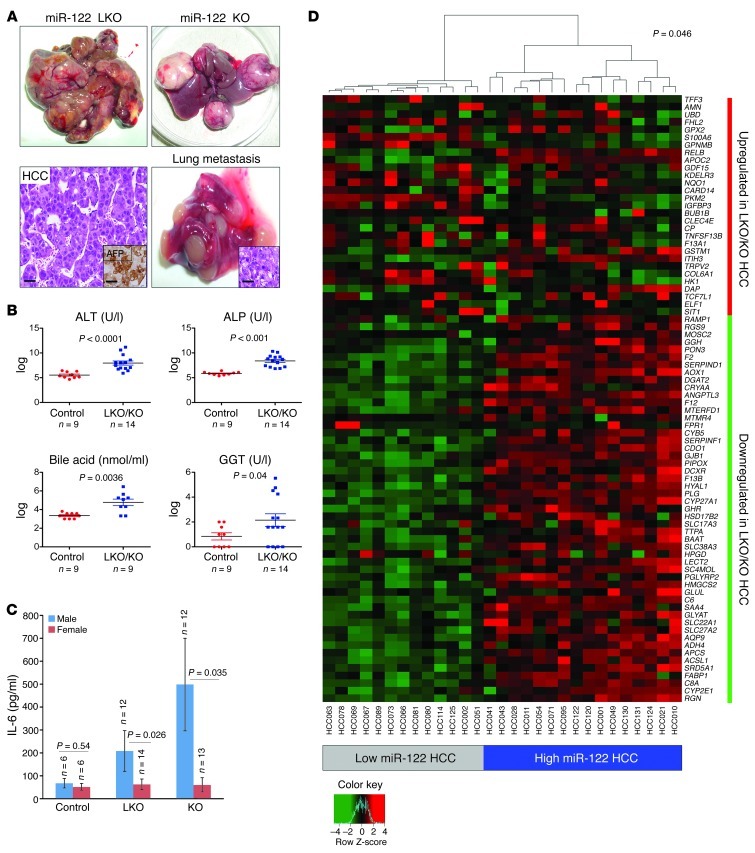
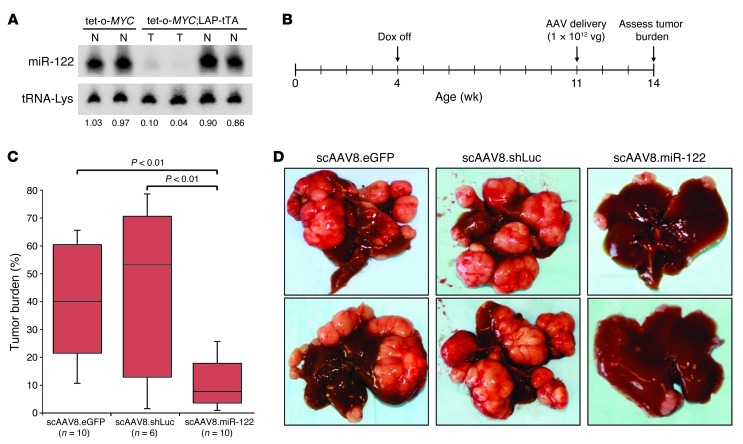
miR-122, an abundant liver-specific microRNA (miRNA), regulates cholesterol metabolism and promotes hepatitis C virus (HCV) replication. Reduced miR-122 expression in hepatocellular carcinoma (HCC) correlates with metastasis and poor prognosis. Nevertheless, the consequences of sustained loss of function of miR-122 in vivo have not been determined. Here, we demonstrate that deletion of mouse Mir122 resulted in hepatosteatosis, hepatitis, and the development of tumors resembling HCC. These pathologic manifestations were associated with hyperactivity of oncogenic pathways and hepatic infiltration of inflammatory cells that produce pro-tumorigenic cytokines, including IL-6 and TNF. Moreover, delivery of miR-122 to a MYC-driven mouse model of HCC strongly inhibited tumorigenesis, further supporting the tumor suppressor activity of this miRNA. These findings reveal critical functions for miR-122 in the maintenance of liver homeostasis and have important therapeutic implications, including the potential utility of miR-122 delivery for selected patients with HCC and the need for careful monitoring of patients receiving miR-122 inhibition therapy for HCV.


Figures

Figure 1
Figure 1. Abnormal liver structure and TG metabolism in Mir122-LKO mice in early adult life.
(A and B) Northern blot analysis of miRNA levels in liver. (C) Representative liver sections of 8-week-old control (floxed) and LKO mice after overnight fasting (n = 8–10 mice per genotype). Scale bars: top row, 200 μm; bottom row, 25 μm. (D) Oil red O– and PAS-stained liver sections from 8-week-old LKO mice after overnight fasting (n = 5 per genotype). Scale bars: top row, 100 μm; bottom row, 100 μm; insets, 25 μm. (E) Transmission electron micrographs of liver sections from 12-week-old LKO mice. Lipid droplets (L), ER, mitochondria (M), and nucleus (N) are labeled. Scale bars: top row, 2 μm; bottom row, 450 nm. (F) CK19 and A6 staining of bile duct and oval cells, respectively, in LKO livers (n = 3 mice per genotype). Scale bars: top row, 100 μm; inset, 5 μm; bottom row, 25 μm. (G) Hepatic TG and cholesterol levels in 10-week-old LKO mice. (H) De novo TG synthesis in liver as measured by 3H1-glycerol incorporation. (I) TG secretion as measured by monitoring serum TG levels after administration of Triton WR-1339. The results presented in GI are mean ± SD. Statistical significance was calculated using a 2-tailed t test.
Figure 2
Figure 2. Altered expression of genes involved in TG metabolism and hepatocarcinogenesis in Mir122-LKO livers.
(A) Sylamer plots (17) showing the enriched hexamers (top), heptamers (middle), and octamers (bottom) in transcripts that are upregulated in LKO livers. All motifs that are statistically significantly enriched are highlighted in color on the plots and correspond to binding sites for the miR-122 seed sequence as shown on the left. (B) Expression of genes involved in TG synthesis and storage in LKO livers. For this and subsequent panels, real-time RT-PCR values represent means from triplicate measurements with multiple samples (n = 4–5). Statistical significance was calculated using a 2-tailed t test. (C) Western blot analysis of microsomal or whole liver extracts. (D) Renilla luciferase activity (LUC2) produced from wild-type or mutant (mut) Agpat1, Cidec, and Mapre1 3′ UTR reporter plasmids or empty vector (pSICHECK2) normalized to firefly luciferase activity (LUC1) produced from the same plasmid after transfection into Hepa cells together with negative control RNA (NC) or miR-122 mimic. Error bars represent SDs derived from 3 independent experiments. (E and F) Expression of transcripts (E) and proteins (F) related to hepatocarcinogenesis in LKO/KO livers.
Figure 3
Figure 3. Mir122-LKO and -KO mice develop hepatitis and fibrosis with age.
(A and C) Portal inflammation, steatosis, and fibrosis in 6-month-old LKO (A) and KO (C) mice. The inset in A depicts foci of altered hepatocytes as observed in some livers. Eight to 10 mice of each genotype were analyzed after overnight fasting. Scale bars for A: top row, 200 μm; second and third rows and inset, 25 μm; fourth row, 200 μm. Scale bars for C: top row, 200 μm; middle row, 25 μm; bottom row, 100 μm. (B and D) Inflammation, steatosis, and fibrosis scores generated through blinded evaluation of histopathology. (E) Hepatic TG and cholesterol levels in 6-month-old mice. The results shown in BD are mean ± SD. Statistical significance was calculated using a 2-tailed t test.
Figure 4
Figure 4. Infiltration of IL-6–producing CD11bhiGr1+ cells in livers of Mir122-KO mice.
(A) Immune cells from the liver of 10-week-old male KO and control mice were quantified by trypan blue exclusion. Statistical significance was calculated using a 2-tailed t test. (B and C) The percentage of CD11bhiGr1+ cells is significantly increased in 10-month-old non-tumor-bearing LKO/KO mice. Flow cytometric data for 1 representative pair of mice (B) and summary data for 3 mice (C) are shown. (D) Intracellular flow cytometric analysis indicates that CD11bhiGr1+ cells but not lymphocytes from the liver express IL-6. (E) Real-time RT-PCR analysis of Ccl2 expression in LKO (10-week-old) and KO (5-week-old) livers compared with age-matched controls. (F and G) Ccl2 expression (F) is reduced in LKO/KO hepatocytes (isolated from 2 LKO mice and 1 KO mouse) upon overexpression of miR-122 (G). NC-S, scrambled negative control. (H and I) Ccl2 (H) or Mir122 (I) expression in Hepa cells transfected with miR-122 mimic versus control (NC-S) or anti–miR-122 (miR-122-AS) versus control (NC-AS). (J) Induction of spliced Ccl2 mRNA and unspliced Ccl2 hnRNA in KO livers (paired t test). (K) Predicted miR-122 binding site in the 3′ UTR of Ccl2 and corresponding mutant site. (L) Luciferase reporter assays as described in Figure 2D. Results are mean ± SD.
Figure 5
Figure 5. Mir122-LKO/KO mice develop spontaneous HCC with age.
(A) Representative photographs of liver and lung tumors that developed in LKO/KO mice. Left lower panel shows a representative section stained with H&E and Afp (inset). Inset in lower right panel shows an H&E stain identifying the lung tumor as metastatic HCC. Scale bars: lower left panel, 25 μm; left inset, 35 μm; right inset, 25 μm. (B) Analysis of serum markers of liver function in control and tumor-bearing LKO/KO mice represented as mean ± SEM. P values were calculated using the Welch’s test after log transformation ALT, alanine aminotransferase. (C) Serum IL-6 levels in control and tumor-bearing LKO/KO mice represented as mean ± SEM. P values were calculated using 2-tailed t test. (D) Heat map and dendrogram showing that the expression levels of genes that are dysregulated in tumors from LKO/KO mice are sufficient to classify human HCCs into high– and low–miR-122–expressing subsets. Significance of this classification was assessed by using a bootstrap method.
Figure 6
Figure 6. AAV-mediated delivery of miR-122 impedes liver tumor growth in tet-o-MYC;LAP-tTA mice.
(A) Northern blot showing miR-122 expression in normal liver (N) or tumor (T) from mice of the indicated genotypes. The normalized miR-122 level is presented below each lane. (B) Time line of miR-122 delivery experiment. Dox, doxycycline; vg, vector genomes. (C) Gross tumor burden of livers from control-treated and miR-122–treated animals, as determined by quantification of tumor area using the ImageJ software package ( http://rsbweb.nih.gov/ij/). Each box represents the range of tumor burden observed. The ends of the boxes represent the 25th and 75th percentiles, the bars indicate the 10th and 90th percentiles, and horizontal lines within the boxes represent the median. (D) Representative images of livers from control-treated or miR-122–treated animals.

Comment in

References

    1. Lagos-Quintana M, Rauhut R, Yalcin A, Meyer J, Lendeckel W, Tuschl T. Identification of tissue-specific microRNAs from mouse. Curr Biol. 2002;12(9):735–739. doi: 10.1016/S0960-9822(02)00809-6. - DOI - PubMed
    1. Krutzfeldt J, et al. Silencing of microRNAs in vivo with ‘antagomirs’. Nature. 2005;438(7068):685–689. doi: 10.1038/nature04303. - DOI - PubMed
    1. Esau C, et al. miR-122 regulation of lipid metabolism revealed by in vivo antisense targeting. Cell Metab. 2006;3(2):87–98. doi: 10.1016/j.cmet.2006.01.005. - DOI - PubMed
    1. Jopling CL, Yi M, Lancaster AM, Lemon SM, Sarnow P. Modulation of hepatitis C virus RNA abundance by a liver-specific MicroRNA. Science. 2005;309(5740):1577–1581. doi: 10.1126/science.1113329. - DOI - PubMed
    1. Lanford RE, et al. Therapeutic silencing of micro­RNA-122 in primates with chronic hepatitis C virus infection. Science. 2010;327(5962):198–201. doi: 10.1126/science.1178178. - DOI - PMC - PubMed

Publication types

MeSH terms