. 2012 Aug;122(8):2884-97.
doi: 10.1172/JCI63455. Epub 2012 Jul 23.

MicroRNA-122 plays a critical role in liver homeostasis and hepatocarcinogenesis

Affiliations

MicroRNA-122 plays a critical role in liver homeostasis and hepatocarcinogenesis

Wei-Chih Tsai et al. J Clin Invest. 2012 Aug.

Abstract

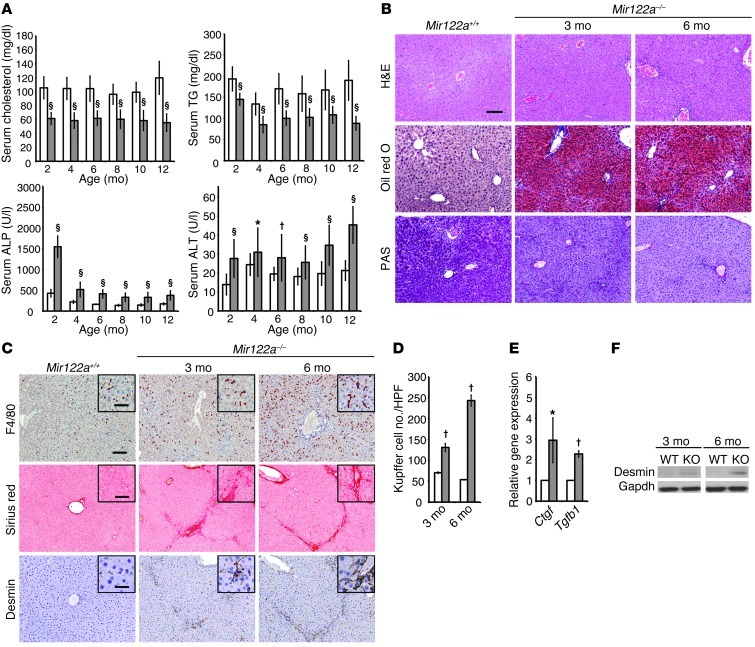
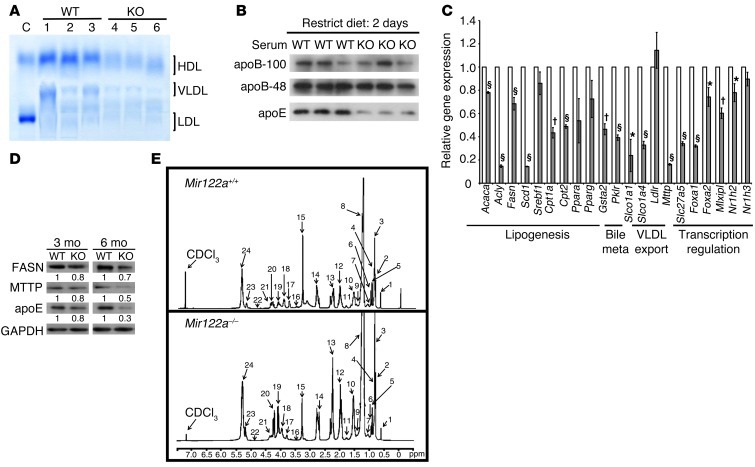
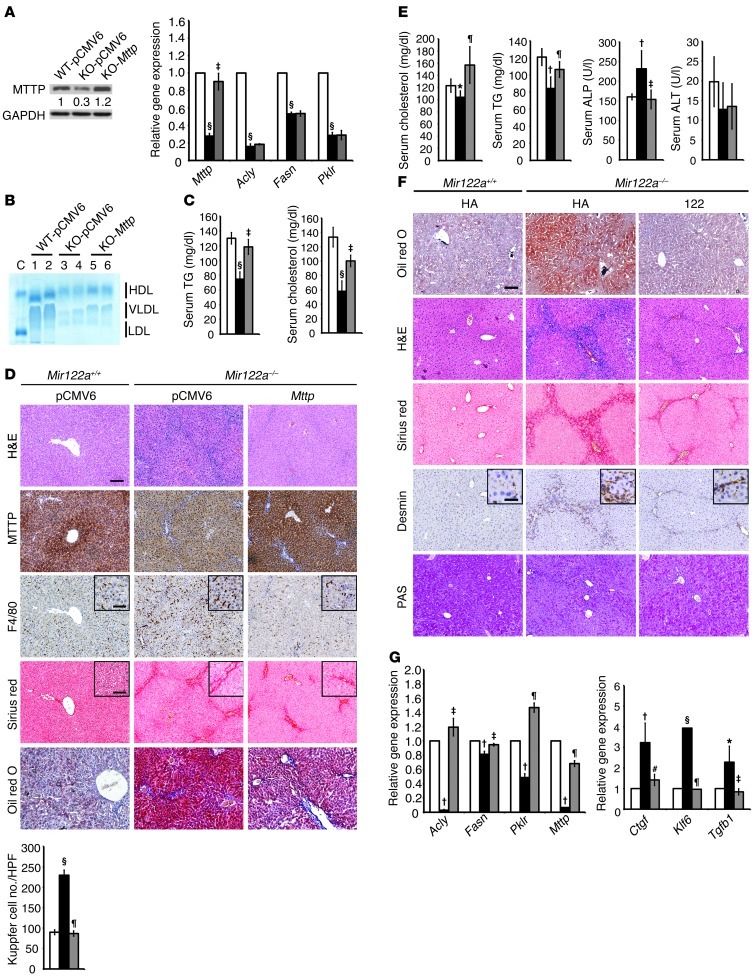
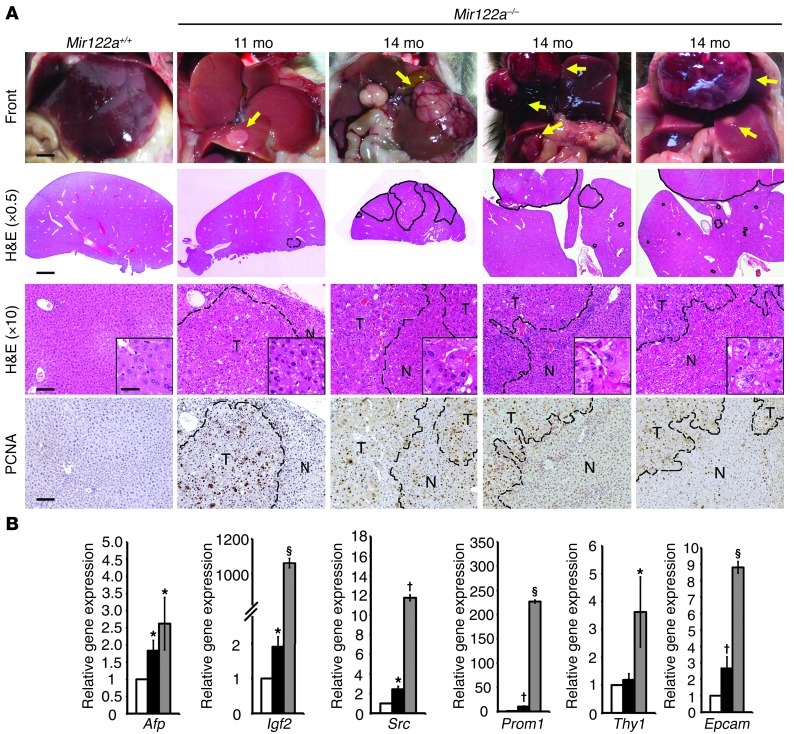
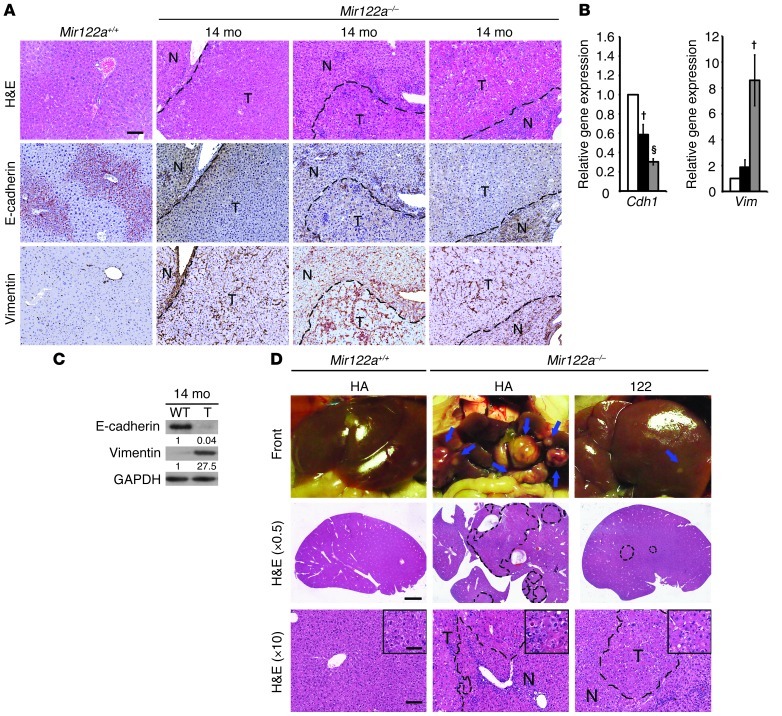
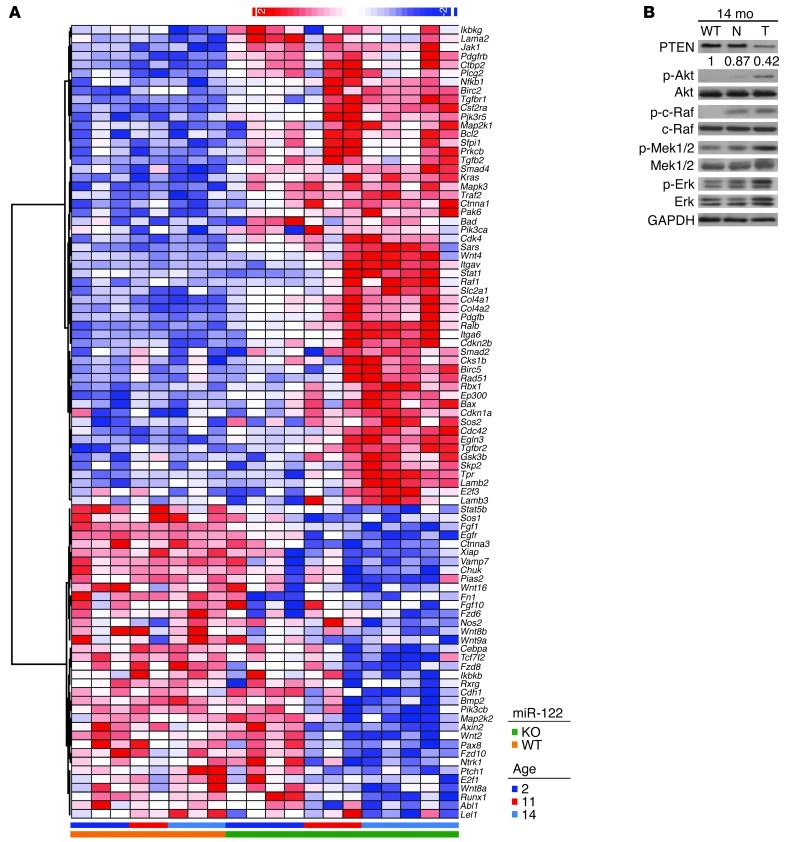
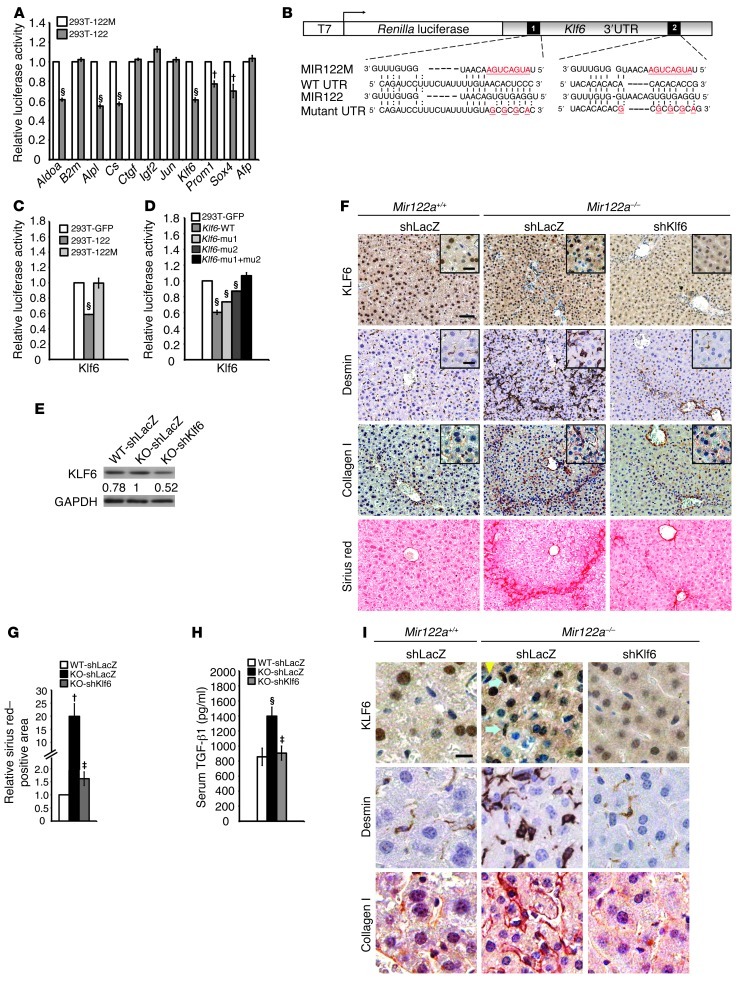
MicroRNA-122 (miR-122), which accounts for 70% of the liver's total miRNAs, plays a pivotal role in the liver. However, its intrinsic physiological roles remain largely undetermined. We demonstrated that mice lacking the gene encoding miR-122a (Mir122a) are viable but develop temporally controlled steatohepatitis, fibrosis, and hepatocellular carcinoma (HCC). These mice exhibited a striking disparity in HCC incidence based on sex, with a male-to-female ratio of 3.9:1, which recapitulates the disease incidence in humans. Impaired expression of microsomal triglyceride transfer protein (MTTP) contributed to steatosis, which was reversed by in vivo restoration of Mttp expression. We found that hepatic fibrosis onset can be partially attributed to the action of a miR-122a target, the Klf6 transcript. In addition, Mir122a(-/-) livers exhibited disruptions in a range of pathways, many of which closely resemble the disruptions found in human HCC. Importantly, the reexpression of miR-122a reduced disease manifestation and tumor incidence in Mir122a(-/-) mice. This study demonstrates that mice with a targeted deletion of the Mir122a gene possess several key phenotypes of human liver diseases, which provides a rationale for the development of a unique therapy for the treatment of chronic liver disease and HCC.


Figures

Figure 1
Figure 1. Pathophysiological features of Mir122a–/– mice.
(A) Total serum cholesterol, fasting TG, ALP, and ALT levels were measured enzymatically on a DRI-CHEM 3500S autoanalyzer (Fujifilm). n = 20 mice per group. White bars, Mir122a+/+; gray bars, Mir122a–/–. (B) Mir122a–/– livers exhibited progressive accumulation of lipid (oil red O) and reduced glycogen storage (PAS). n = 6. (C) The progressive increase in the number of Kupffer cells (F4/80 antibody) and the activation of HSCs near the portal regions (Sirius red staining and anti-desmin antibody) in Mir122a–/– livers. Scale bars: 100 μm, 50 μm (insets), and 20 μm (insets, desmin). n = 6. (D) The number of Kupffer cells (anti-F4/80) per high-power field (×200). n = 10. (E) RT-qPCR results for 2 markers of fibrosis (Ctgf and Tgfb1). n = 8 per group. (F) Western blot analysis of desmin expression. The results shown are representative of 5 independent experiments. *P < 0.05, P < 0.01, §P < 0.001.
Figure 2
Figure 2. Analysis of lipid metabolism.
(A) Serum levels of lipoproteins. C, control: normal human serum; KO, Mir122a–/– mice. (B) Western blot analysis of the serum apoproteins. (C) RT-qPCR analysis of the genes involved in lipid metabolism. n = 5. *P < 0.05, P < 0.01, §P < 0.001. (D) Western blot analysis of hepatic proteins. This blot is representative of 3 independent experiments. Values represent the relative levels of protein expression between Mir122a–/– and WT. (E) 1H-NMR spectra of hepatic lipid contents. 1H-NMR spectra of lipid extracts from liver of WT and Mir122a–/– mice (Mir122a-KO). Identified peaks: 1: total cholesterol C-18, CH3; 2: total cholesterol C-26, CH3/C-27, CH3; 3: fatty acyl chain CH3(CH2)n; 4: total cholesterol C-21, CH3; 5: free cholesterol C-19, CH3; 6: esterified cholesterol C-19, CH3; 7: multiple cholesterol protons; 8: fatty acyl chain (CH2)n; 9: multiple cholesterol protons; 10: fatty acyl chain -CH2CH2CO; 11: multiple cholesterol protons; 12: fatty acyl chain -CH2CH=; 13: fatty acyl chain -CH2CO; 14: fatty acyl chain =CHCH2CH=; 15: sphingomyelin and choline N(CH3)3; 16: free cholesterol C-3, CH; 17: phosphatidylcholine N-CH2; 18: glycerophospholipid backbone C-3, CH2; 19: glycerol backbone C-1, CH2; 20: glycerol backbone C-3, CH2; 21: phosphatidylcholine PO-CH2; 22: esterified cholesterol C-3, CH; 23: glycerolphospholipid backbone C-2, CH; 24: fatty acyl chain -HC=CH-.
Figure 3
Figure 3. Liver damage in Mir122a–/– mice is reversible.
(A) In vivo delivery of Mttp increased expression at both the mRNA and protein levels as shown by Western blotting (left) and RT-qPCR (right), respectively. Restoration of Mttp results in the return of the serum levels of lipoproteins (B), cholesterol, and TG (C) to WT levels and in the reduction of fatty accumulation, inflammation (F4/80 IHC), and collagen deposition (D). White bars, WT-pCMV6-Neo; black bars, KO-pCMV6-Neo; gray bars, KO-Mttp (pCMV6-Mttp). n = 5. Scale bars: 100 μm and 50 μm (insets). (E) Restoration of miR-122a at day 14 leads to the return of serum cholesterol, TG, and ALP to WT levels. White bars, WT-HA; black bars, KO-HA; gray bars, KO-122. n = 5. (F) Restoration of miR-122a at 1 month leads to a drastic reduction in fatty accumulation, collagen deposition, activation of HSCs (anti-desmin), and a moderate increase in glycogen storage. Scale bars: 100 μm and 20 μm (insets). n = 5. (G) Left: RT-qPCR assay of lipid metabolism genes. n = 3. Right: RT-qPCR assay of markers of fibrosis. White bars, WT-HA; black bars, KO-HA; gray bars, KO-122. n = 6. *P < 0.05, P < 0.01, §P < 0.001 for KO-vehicle versus WT-vehicle mice; #P < 0.05, P < 0.01, P < 0.001 for KO-gene versus KO-vehicle mice.
Figure 4
Figure 4. Spontaneous liver tumors developed in Mir122a–/– mice.
(A) A small, round-shaped, solid tumor from an 11-month-old male Mir122a–/– mouse and multiple larger tumors from 3 14-month-old male Mir122a–/– mice. Scale bars: 3 mm (front), 2 mm (H&E, original magnification, ×0.5), 100 μm (H&E, ×10; and anti-PCNA) and 50 μm (insets). The dotted lines show the edges of the normal liver area (N) and tumor area (T). The tumors display invasive edges. (B) RT-qPCR assays of 3 oncofetal genes (Afp, Igf2, Src) and 3 tumor-initiating cell markers (Prom1, Thy1, Epcam). White bars, WT; black bars, tumor-adjacent tissues; gray bars, tumor. n = 3. *P < 0.05, P < 0.01, §P < 0.001 versus WT.
Figure 5
Figure 5. Deficiency of miR-122a triggers EMT.
Expression of E-cadherin is downregulated and expression of vimentin is upregulated in Mir122a–/– tumor tissue as shown by immunohistochemistry (A; n = 5; scale bars: 100 μm); by RT-qPCR assay (B; white bars, WT; black bars, tumor-adjacent tissues; gray bars, tumor; n = 3); and by Western blotting (C). A representative of 4 independent Western blotting experiments is shown. (D) Long-term reexpression of miR-122a over an 8-month duration. Left: Mir122a+/+ mice expressing HA vector; center: Mir122a–/– mice expressing HA vector; right: Mir122a–/– mice expressing miR-122 construct. Scale bars: 2 mm (H&E, ×0.5), 100 μm (H&E, ×10), and 50 μm (insets). P < 0.01, §P < 0.001 versus WT.
Figure 6
Figure 6. Expression profiling of the genes in the KEGG Pathways in Cancer set.
(A) The heat map shows the 91 genes in the KEGG Pathways in Cancer that are differentially expressed in the livers of 2-month-old mice and tumor tissues from 11-month- and 14-month-old male Mir122a–/– mice (cutoff, 1.5). The heat scale of the map represents changes on a linear scale. Red and blue denote upregulated and downregulated gene expression, respectively. Relative expression levels of the genes in the KEGG Pathway in Cancer gene set are listed in Supplemental Table 5. (B) Activation of the Akt and MAPK pathways in Mir122a–/– mice. WT, normal livers from 14-month-old mice; N, tumor-adjacent tissues; T, tumor. A representative of 3 independent experiments is shown. Values represent the relative levels of PTEN protein expression between WT and the tumor-adjacent tissues (N) or the tumor tissues (T) of Mir122a–/– livers.
Figure 7
Figure 7. Klf6 is a miR-122a target gene and contributes to hepatic fibrogenesis.
(A) A 3′ UTR reporter assay was used to verify the targets. Luciferase reporter activity of 8 3′ UTR constructs in HEK293T cells overexpressing miR-122 (293T-122) or mutant MIR122 (293T-122M). Aldoa and B2m are the positive and the negative controls, respectively. (B) Diagram depicting the seed region of MIR122, the mutated seed region of MIR122 (MIR122M), and the two binding site mutations (mu1 and mu2) within the 3′ UTR of Klf6. (C) Luciferase reporter activity of the Klf6–3′ UTR construct in 293T-GFP, 293T-122, or 293T-122M. (D) Luciferase reporter activity of the Klf6–3′ UTR constructs containing WT, mu1, or mu2 in 293T-GFP or 293T-122. The data are representative of 3 experiments. §P < 0.001. The hydrodynamic injection of shKlf6 reduced the expression of KLF6 (E and F) and reduced HSC cell activation and collagen deposition (F) in Mir122a–/– livers. Values in E represent the levels of KLF6 protein expression of mice with different treatments relative to the level in KO-shLacZ livers. Scale bars: 50 μm and 20 μm (insets). shLacZ is a control for RNA interference. (G) Quantitation of Sirius red staining. Ten different microscopic fields for each sample were evaluated with the MetaMorph software (Molecular Devices). (H) The serum level of TGF-β1 was reduced. n = 3 mice per group. P < 0.01, §P < 0.001 for KO-shLacZ versus WT-shLacZ mice; P < 0.01 for KO-shKlf6 versus KO-shLacZ mice. (I) Enlarged images of the insets of F. Scale bars: 10 μm. Expression of KLF6 is found in both the hepatocytes and HSCs (with ellipsoidal nucleus). Blue arrows, KLF6hi HSCs; yellow arrowhead, KLF6lo HSC.

Comment in

References

    1. Lagos-Quintana M, Rauhut R, Yalcin A, Meyer J, Lendeckel W, Tuschl T. Identification of tissue-specific microRNAs from mouse. Curr Biol. 2002;12(9):735–739. doi: 10.1016/S0960-9822(02)00809-6. - DOI - PubMed
    1. Song L, Tuan RS. MicroRNAs and cell differentiation in mammalian development. Birth Defects Res C Embryo Today. 2006;78(2):140–149. doi: 10.1002/bdrc.20070. - DOI - PubMed
    1. Fazi F, Nervi C. MicroRNA: basic mechanisms and transcriptional regulatory networks for cell fate determination. Cardiovasc Res. 2008;79(4):553–561. doi: 10.1093/cvr/cvn151. - DOI - PubMed
    1. Chang J, et al. miR-122, a mammalian liver-specific microRNA, is processed from hcr mRNA and may downregulate the high affinity cationic amino acid transporter CAT-1. RNA Biol. 2004;1(2):106–113. doi: 10.4161/rna.1.2.1066. - DOI - PubMed
    1. Krützfeldt J, et al. Silencing of microRNAs in vivo with ‘antagomirs’. Nature. 2005;438(7068):685–689. doi: 10.1038/nature04303. - DOI - PubMed

Publication types

MeSH terms