. 2012 Aug;30(8):777-82.
doi: 10.1038/nbt.2282.

Full-length mRNA-Seq from single-cell levels of RNA and individual circulating tumor cells

Affiliations

Full-length mRNA-Seq from single-cell levels of RNA and individual circulating tumor cells

Daniel Ramsköld et al. Nat Biotechnol. 2012 Aug.

Erratum in

Abstract

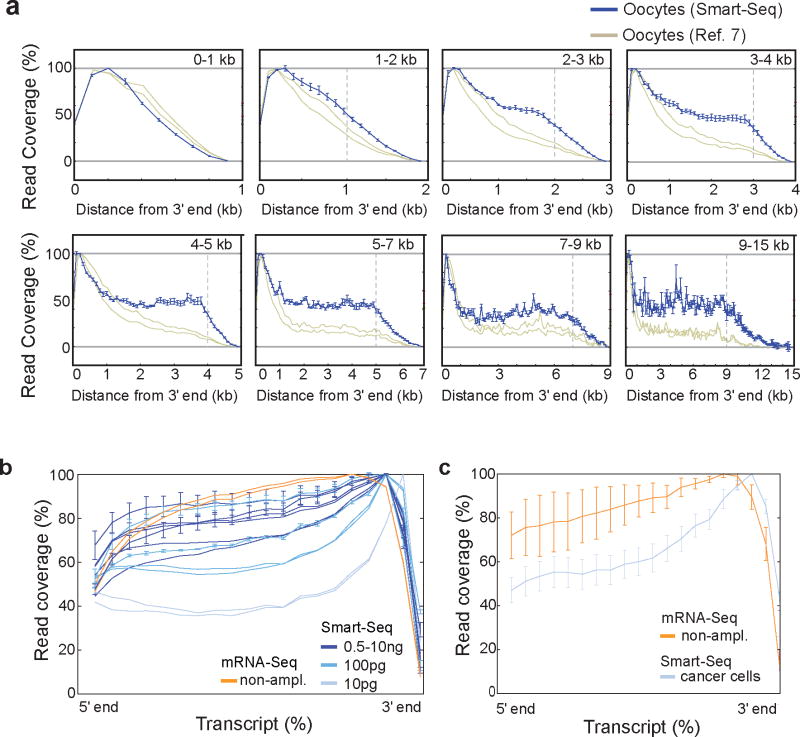
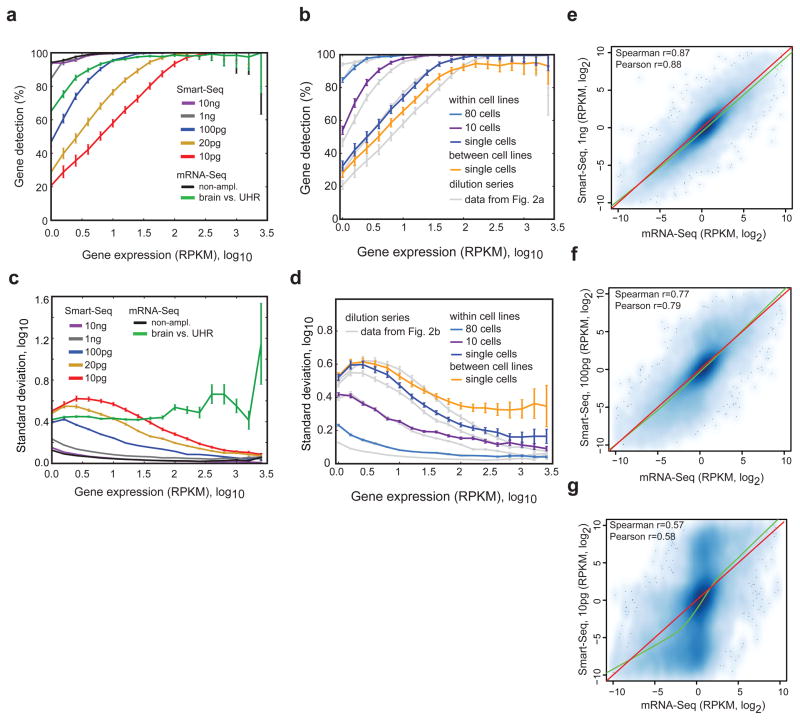
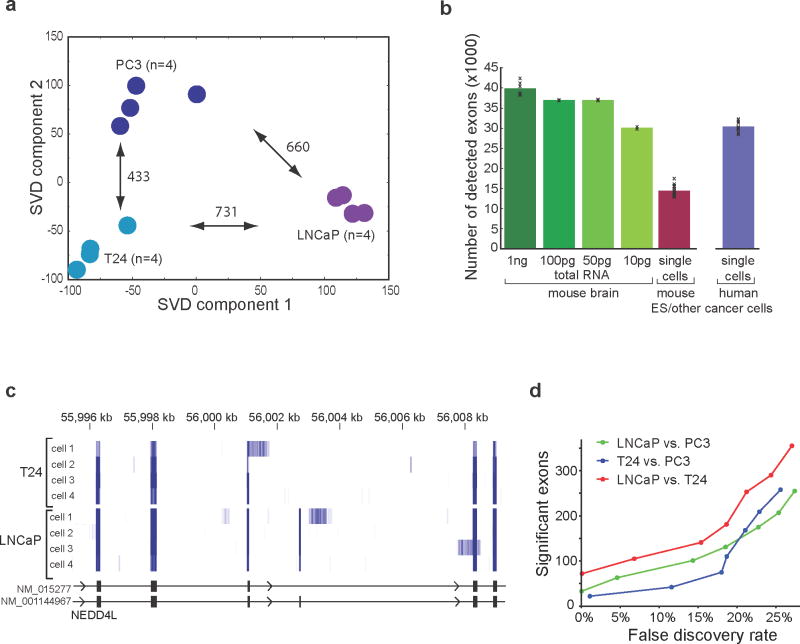
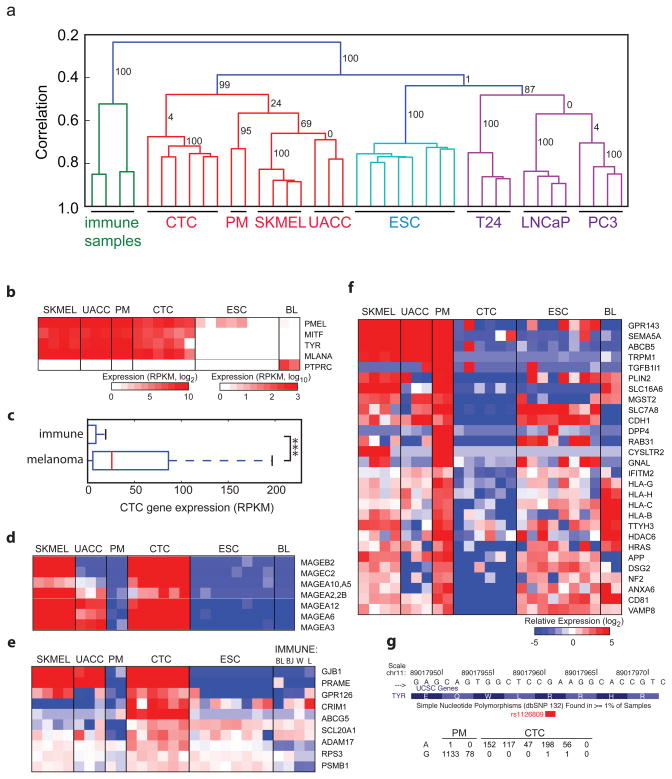
Genome-wide transcriptome analyses are routinely used to monitor tissue-, disease- and cell type–specific gene expression, but it has been technically challenging to generate expression profiles from single cells. Here we describe a robust mRNA-Seq protocol (Smart-Seq) that is applicable down to single cell levels. Compared with existing methods, Smart-Seq has improved read coverage across transcripts, which enhances detailed analyses of alternative transcript isoforms and identification of single-nucleotide polymorphisms. We determined the sensitivity and quantitative accuracy of Smart-Seq for single-cell transcriptomics by evaluating it on total RNA dilution series. We found that although gene expression estimates from single cells have increased noise, hundreds of differentially expressed genes could be identified using few cells per cell type. Applying Smart-Seq to circulating tumor cells from melanomas, we identified distinct gene expression patterns, including candidate biomarkers for melanoma circulating tumor cells. Our protocol will be useful for addressing fundamental biological problems requiring genome-wide transcriptome profiling in rare cells.


Conflict of interest statement

The reported sequence read data have been deposited in Gene Expression Omnibus at NCBI (GSE38495). S.L., R.L., I.K., and G.P.S. are employees and shareholders of Illumina Inc, but the remaining authors have no competing financial interests.

Figures

Figure 1
Figure 1. Smart-Seq read coverage across transcripts
(a) Comparison of read coverage over transcripts for Smart-Seq analyzed mouse oocytes (green, n=3) and previously published mouse oocyte transcriptome data (red, n=2). Transcripts were grouped according to annotated lengths and analyzed separately, with the transcript lengths indicated in the top right corner of each panel. In each panel, we display the read coverage over the transcripts as a distance from the 3′ end (x-axis), with the vertical dashed gray line showing the length of the shortest included transcripts after which a decline in read coverage is expected. Error bars represent standard deviations among biological replicates. (b) Mean read coverage over transcripts for Smart-Seq data generated from diluted amounts of mouse brain RNA. Independent dilution series (including data from different labs) are shown as separate data sets. For comparison, we included data from standard mRNA-Seq on 100 ng of mouse brain RNA (black). Errors bars represent standard deviations. (c) Read coverage (as in b) for twelve individual human cells of prostate and bladder cancer line origin, analyzed using Smart-Seq (purple) and for prostate cell line LNCaP analyzed with standard mRNA-Seq (black).
Figure 2
Figure 2. Sensitivity and variability in Smart-Seq from few or single cells
(a) Percentage of genes reproducibly detected within replicate pairs, binned according to expression level. We performed all pair-wise comparisons within groups of replicates and report the mean and 90% confidence interval. We used Smart-Seq data generated from diluted amounts of human UHR total RNA as indicated. As controls, we added both a comparison of technical replicates of human UHRR analyzed using standard mRNA-Seq protocols with 100 ng input RNA (black line), as well as a comparison of human UHRR and brain RNA from standard mRNA-Seq data (green line). (b) Percentage of genes reproducibly detected within replicate pairs, binned according to expression level (as in a) for human LNCaP, PC3 and T24 cells. We show pair-wise comparisons among single cells from the same cancer cell line (blue line), among multiple cells of the same cell line (purple and blue lines), and comparisons among single cells from different cancer cell lines (yellow line). (c) Standard deviation in gene expression estimates within replicates in bins of genes sorted according to expression levels. Comparisons and colors coded in the same way as in (a) and error bars represents standard error of the mean. (d) Standard deviation in gene expression estimates within replicates (as in c, with comparisons and colors coded in the same manner as in b). (e–g) Scatter plots showing the relative differences between human UHRR and brain gene expression levels estimated from standard mRNA-Seq data on 100 ng input RNA (x-axis) and Smart-Seq generated data (y-axis) starting from 1 ng total RNA (e), 100 pg total RNA (f) and 10 pg total RNA (g). Correlation coefficients computed from log2 transfomed relative gene expression profiles, together with non-linear loess regression curves (green) and y=x lines (red).
Figure 3
Figure 3. Transcriptional and post-transcriptional analyses of cancer cell line cells using Smart-Seq
(a) Categorization of individual cells according to cell line of origin using single-cell Smart-Seq transcriptomes. Singular-value decomposition analysis was conducted for 12 individual cancer cells (4 cells each from the PC3, LNCaP and T24 cancer cell lines) based on global gene expression profiles. Projections are shown based on the first two dimensions that capture most of the variance. The numbers of significantly differentially expressed genes per pairwise cell line comparison are shown next to the arrows (p<0.05, 1-way ANOVA and Tukey post-hoc test). (b) Mean number of alternatively spliced exons with sufficient read coverage for MISO analyses in sequence-depth matched single-cell mRNA-Seq data. Smart-Seq data from diluted mouse brain RNA (green) compared with previously published mouse ES cells (red) and twelve Smart-Seq analyzed individual prostate and bladder cell line cells (purple). The error bars represent standard deviation. (c) Single-cell Smart-Seq reads mapping to a portion of the NEDD4L gene locus from four individual T24 and LNCaP cells. Read coverage is shown as a heatmap with darker blue indicating higher read coverage. (d) Number of differentially included exons identified among the PC3, LNCaP and T24 cell lines from single-cell Smart-Seq analysis on four cells per cell line as a function of estimated false discovery rate.
Figure 4
Figure 4. Single-cell transcriptomes of circulating tumor cells
(a) Hierarchical clustering of human samples based on gene expression of highly expressed genes (>100 RPKM). Coloring indicates high-order clusters and the confidence in clusters are indicated with bootstrap values (percentage). Samples analyzed include human immune samples (Burkitt’s lymphoma cell lines BL41 and BJAB, and white blood cells and lymphnode samples) and cells from putative melanoma circulating tumor cells (CTC), primary melanocytes (PM), melanoma cell lines SKMEL5 (SKMEL) and UACC257 (UACC), prostate cancer cell lines (LNCaP, PC3), bladder cancer cell line (T24) and human embryonic stem cells (ESC). (b) Expression of melanocyte makers (PMEL, MITF, TYR, MLANA) and immune marker PTPRC in single-cell transcriptomes from (a) with Burkitt’s lymphoma cell lines BL41 and BJAB (BL). (c) Gene expression levels in CTCs for an unbiased set of 100 immune and melanoma markers. (d–f) Heatmaps showing relative expression of melanoma associated tumor antigens (d), up-regulated plasma-membrane proteins (e), and down-regulated plasma-membrane proteins (f) in single-cell transcriptomes as in (b) with the addition of more immune samples (W: white blood cells, L: lymphnode). (g) Number of reads from individual PMs and putative CTCs that support the reference (G) or risk (A) allele for the melanoma-associated SNP (rs1126809).

Comment in

Similar articles

Cited by

References

    1. Mortazavi A, Williams B, McCue K, Schaeffer L, Wold B. Mapping and quantifying mammalian transcriptomes by RNA-Seq. Nat Methods. 2008 doi: 10.1038/nmeth.1226. - DOI - PubMed
    1. Guttman M, et al. Ab initio reconstruction of cell type-specific transcriptomes in mouse reveals the conserved multi-exonic structure of lincRNAs. Nat Biotechnol. 2010;28:503–510. - PMC - PubMed
    1. Trapnell C, et al. Transcript assembly and quantification by RNA-Seq reveals unannotated transcripts and isoform switching during cell differentiation. Nat Biotechnol. 2010;28:511–515. - PMC - PubMed
    1. Wang ET, et al. Alternative isoform regulation in human tissue transcriptomes. Nature. 2008;456:470–476. - PMC - PubMed
    1. Pan Q, Shai O, Lee LJ, Frey BJ, Blencowe BJ. Deep surveying of alternative splicing complexity in the human transcriptome by high-throughput sequencing. Nature Genetics. 2008;40:1413–1415. - PubMed

Publication types

MeSH terms

Associated data