Review
. 2012 Oct;64(13):1488-507.
doi: 10.1016/j.addr.2012.07.008. Epub 2012 Jul 20.

Personalized nanomedicine advancements for stem cell tracking

Affiliations
Review

Personalized nanomedicine advancements for stem cell tracking

Miroslaw Janowski et al. Adv Drug Deliv Rev. 2012 Oct.

Abstract

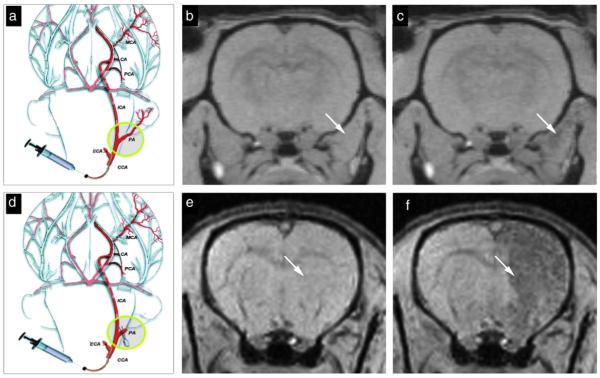
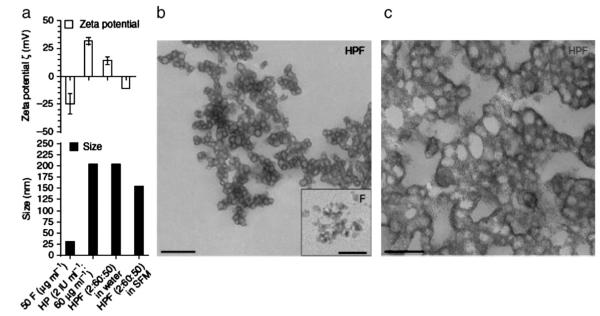
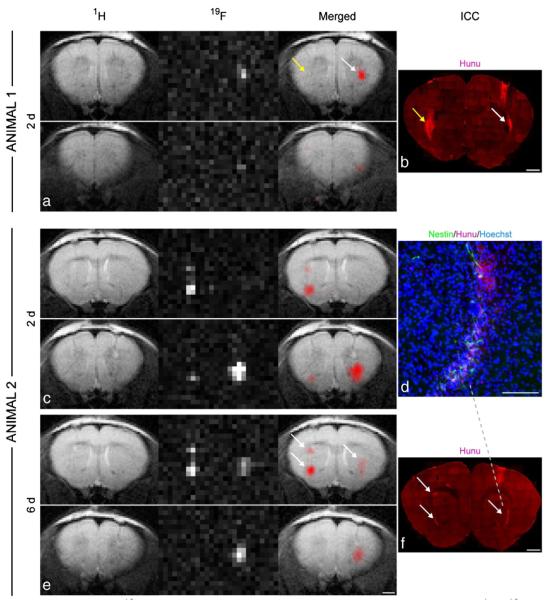
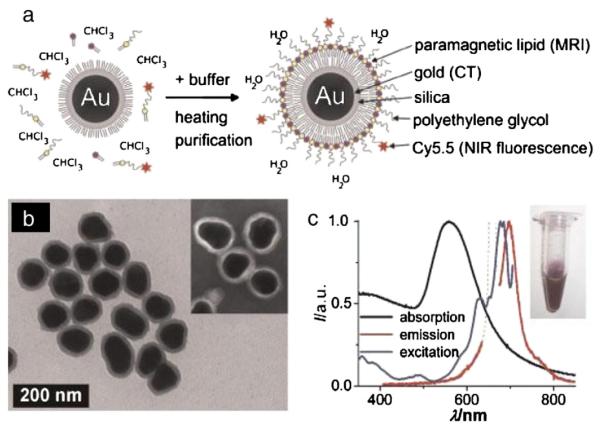
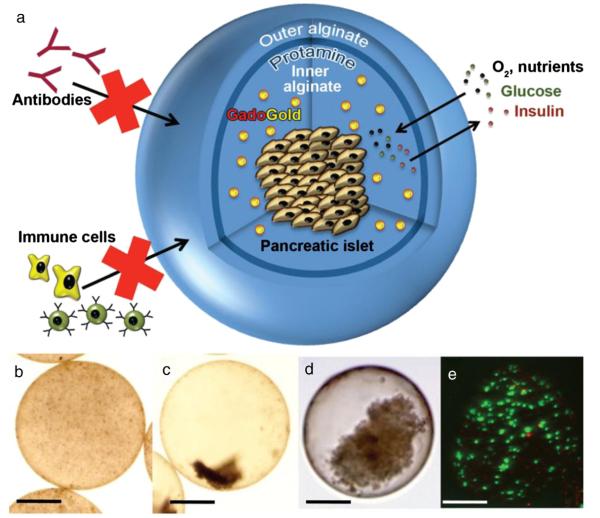
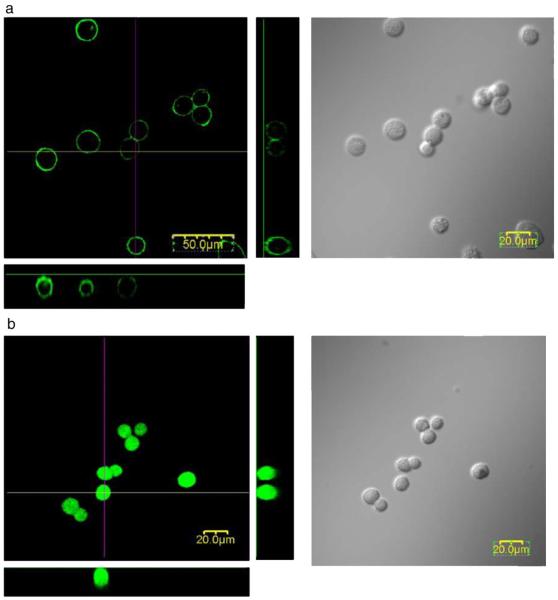
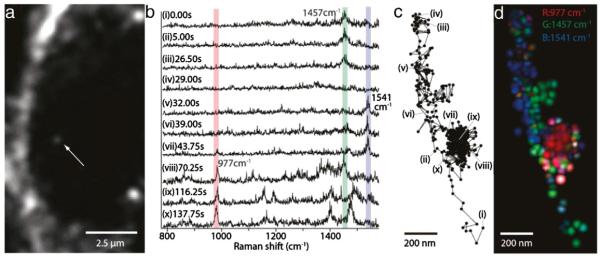
Recent technological developments in biomedicine have facilitated the generation of data on the anatomical, physiological and molecular level for individual patients and thus introduces opportunity for therapy to be personalized in an unprecedented fashion. Generation of patient-specific stem cells exemplifies the efforts toward this new approach. Cell-based therapy is a highly promising treatment paradigm; however, due to the lack of consistent and unbiased data about the fate of stem cells in vivo, interpretation of therapeutic effects remains challenging hampering the progress in this field. The advent of nanotechnology with a wide palette of inorganic and organic nanostructures has expanded the arsenal of methods for tracking transplanted stem cells. The diversity of nanomaterials has revolutionized personalized nanomedicine and enables individualized tailoring of stem cell labeling materials for the specific needs of each patient. The successful implementation of stem cell tracking will likely be a significant driving force that will contribute to the further development of nanotheranostics. The purpose of this review is to emphasize the role of cell tracking using currently available nanoparticles.


Figures

Fig. 1
Fig. 1
Real-time MR monitoring of injection accuracy. Following ligation of the external carotid and occipital arteries, the common carotid artery was cannulated (a) and SPIO-labeled cells were infused. In this experiment, the pterygopalatine artery was left intact. MR images were acquired immediately pre-injection (b) and post-injection (c). MR images demonstrate that the vast majority of cells localized into the extracerebral tissue, with negligible binding within the brain. When the pterygopalatine artery was ligated (d), all infused cells were perfused into the internal carotid artery and localized successfully into the ipsilateral hemisphere. Shown are the MR images acquired immediately before (e) and after injection (f). Reproduced, with permission, from Ref. [113].
Fig. 2
Fig. 2
Characteristics of self-assembling heparin (H), protamine (P), and ferumoxytol (F) nanocomplexes (HPFs). (a) Graphs of the zeta potential (ζ) (top) and the particle size (bottom) of HPF nanocomplexes at a ratio of 2 IU ml−1 heparin: 60 μg ml−1 protamine: 50 μg ml−1 Feraheme® in sterile water and serum-free medium (SFM). Data are shown as mean±s.d. (b) HPF nanocomplexes formed by combining 2 IU ml−1 heparin: 60 μg ml−1 protamine: 50 μg ml−1 Feraheme® in sterile water, as observed by TEM. Scale bar, 0.6 μm. Inset, native Feraheme® nanoparticles. Scale bar, 20 nm. (c) HPFs at higher magnification. Scale bar, 0.3 μm. Reproduced, with permission, from Ref. [143].
Fig. 3
Fig. 3
In vivo 19F MRI and correlation with immunohistochemistry. 1H, 19F, and merged MR images of a mouse (animal 1), which had been injected with non-labeled control cells into the left striatum and labeled NSCs into the right hemisphere (a). Only the labeled cells generated a 19F signal, whereas anti-human nuclear antigen (Hunu) staining confirmed the presence of cell grafts on both sides, indicated by the arrows (b). MRI of another mouse (animal 2) two days (c) and six days (e) after grafting showed no major signal loss in the 19F images over time. This animal had received two deposits of labeled cells in the left striatum and one deposit in the right striatum. The location and intensity of 19F signal from cell clusters, marked with white arrows, correlated well with anti-Hunu staining on histological sections. Note that the 19F resolution allows the distinction of the two clusters in the left hemisphere (b, f). Only cells that were clearly immunoreactive to HuNu were considered as grafted human NSCs (d). Scale bars are 50 mm for d, 1 mm for all others. Reproduced, with permission, from Ref. [192].
Fig. 4
Fig. 4
(a) Schematic representation of the nanoparticle lipid-coating procedure. (b) TEM image of hydrophobic gold/silica particles (88±9 nm). The inset shows a negative stain TEM image of the lipid-coated particles. (c) Absorption (black), emission (lexc 660 nm; red), and excitation (lem 710 nm; blue) spectra of the aqueous lipid-coated gold/silica particle dispersion (inset). Note that the dotted line in the emission spectrum is due to scattered excitation light, and thus, not attributable to Cy5.5 emission. Reproduced, with permission, from Ref. [255]. (For interpretation of the references to color in this figure legend, the reader is referred to the web version of this article.)
Fig. 5
Fig. 5
(a) Three-dimensional scheme of alginate-protamine sulfate-alginate (APSA) microcapsule containing GadoGold (GG). The semi-permeable microcapsule allows diffusion of oxygen, nutrients, glucose, and insulin, while the passage of immune cells and antibodies is blocked. (b ,c) Light microscopic images of the APSA-GG microcapsule 1 h (b) and two days (c) after synthesis. (d) Human pancreatic islet inside the APSA-GG microcapsule. (e) Fluorescence microscopic image shows viability staining of mouse insulinoma β-TC-6 cells inside the APSA-GG microcapsule. Green (fluorescein diacetate stain)=live cells, red (propidium iodide stain)=dead cells. Scale bars=200 mm. Reproduced, with permission, from Ref. [270].
Fig. 6
Fig. 6
Confocal fluorescence and differential interference images of (a) FITC-PEG-lipid-modified HEK293 cells and (b) FITC-treated HEK293 cells. (a) A solution of FITC-PEG-lipid in HBSS was added to an HEK293 cell suspension ([PEG-lipids]=100 μM). (b) An aqueous solution of FITC was added to a HEK293 cell suspension. These pictures were taken within an hour after incubation with PEG-lipids for 2 h. Reproduced, with permission, from Ref. [276].
Fig. 7
Fig. 7
SERS analysis of the cellular pathway with an endocytosed gold nanoparticle. (a) An image of a J774A.1 macrophage cell obtained with a dark-field microscope. The white arrow indicates a gold nanoparticle, seen as a small white spot. The gold nanoparticle is taken up by endocytosis of the cell. (b) SERS spectra, obtained from the nanoparticle indicated in panel a. Characteristic Raman peaks were observed at 977 cm−1 (assigned to the vibration mode of phosphate), 1457 cm−1 (vibration mode of CH2 and CH3), and 1541 cm−1 (vibration mode of Amide II). These three Raman peaks are overlaid with bars in red, green, and blue. (c) Trajectory of the nanoparticle, marked by a white arrow in panel a, obtained from the dark-field images. (d) An RGB color map of the molecular distribution displayed on the nanoparticle trajectory. Green spots show the Raman intensity distribution of 1457 cm 1, blue spots 1541 cm−1, and red spots 977 cm−1. The green and blue colors are highlighted along the linear paths, while the red color appears along the confined zone random walk. The spatial resolution is determined as ~65 nm, resulting from the particle diameter of ~50 nm and a measurement accuracy of ~15 nm. Reproduced, with permission, from Ref. [296]. (For interpretation of the references to color in this figure legend, the reader is referred to the web version of this article.)

References

    1. Tarrant C, Windridge K, Boulton M, Baker R, Freeman G. How important is personal care in general practice? BMJ. 2003;326:1310. - PMC - PubMed
    1. Kearley KE, Freeman GK, Heath A. An exploration of the value of the personal doctor–patient relationship in general practice. Br. J. Gen. Pract. 2001;51:712–718. - PMC - PubMed
    1. Ridd M, Shaw A, Lewis G, Salisbury C. The patient–doctor relationship: a synthesis of the qualitative literature on patients’ perspectives. Br. J. Gen. Pract. 2009;59:e116–e133. - PMC - PubMed
    1. Hood L. Biotechnology and medicine of the future. JAMA. 1988;259:1837–1844. - PubMed
    1. Meyer UA. Pharmacogenetics—five decades of therapeutic lessons from genetic diversity. Nat. Rev. Genet. 2004;5:669–676. - PubMed

Publication types