. 2012 Nov;1822(11):1671-81.
doi: 10.1016/j.bbadis.2012.07.004. Epub 2012 Jul 20.

Na+ and K+ ion imbalances in Alzheimer's disease

Affiliations

Na+ and K+ ion imbalances in Alzheimer's disease

Victor M Vitvitsky et al. Biochim Biophys Acta. 2012 Nov.

Abstract

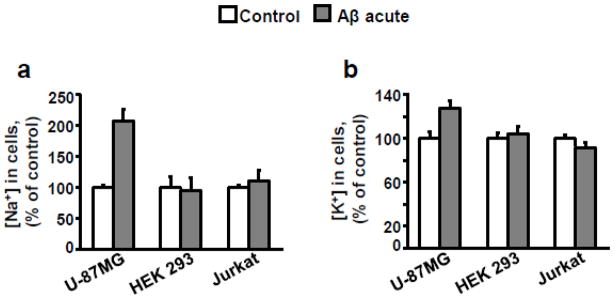
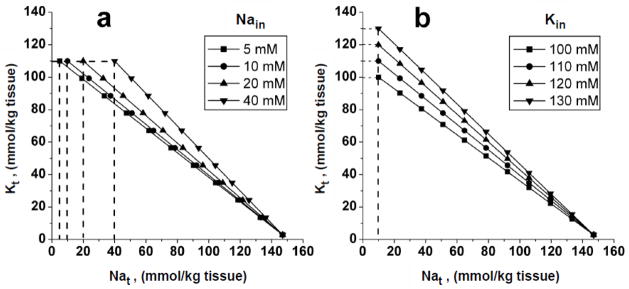
Alzheimer's disease (AD) is associated with impaired glutamate clearance and depressed Na(+)/K(+) ATPase levels in AD brain that might lead to a cellular ion imbalance. To test this hypothesis, [Na(+)] and [K(+)] were analyzed in postmortem brain samples of 12 normal and 16 AD individuals, and in cerebrospinal fluid (CSF) from AD patients and matched controls. Statistically significant increases in [Na(+)] in frontal (25%) and parietal cortex (20%) and in cerebellar [K(+)] (15%) were observed in AD samples compared to controls. CSF from AD patients and matched controls exhibited no differences, suggesting that tissue ion imbalances reflected changes in the intracellular compartment. Differences in cation concentrations between normal and AD brain samples were modeled by a 2-fold increase in intracellular [Na(+)] and an 8-15% increase in intracellular [K(+)]. Since amyloid beta peptide (Aβ) is an important contributor to AD brain pathology, we assessed how Aβ affects ion homeostasis in primary murine astrocytes, the most abundant cells in brain tissue. We demonstrate that treatment of astrocytes with the Aβ 25-35 peptide increases intracellular levels of Na(+) (~2-3-fold) and K(+) (~1.5-fold), which were associated with reduced levels of Na(+)/K(+) ATPase and the Na(+)-dependent glutamate transporters, GLAST and GLT-1. Similar increases in astrocytic Na(+) and K(+) levels were also caused by Aβ 1-40, but not by Aβ 1-42 treatment. Our study suggests a previously unrecognized impairment in AD brain cell ion homeostasis that might be triggered by Aβ and could significantly affect electrophysiological activity of brain cells, contributing to the pathophysiology of AD.


Figures

Fig. 1
Fig. 1. The effect of different concentrations and forms of Aβ 25–35 on intracellular levels of Na+ and K+ in primary mouse astrocytes
Cells were treated acutely (grey bars) or repeatedly (black bars) with different concentrations of Aβ 25–35 or with 50 μM of Aβ 35-25 and intracellular Na+ (a) and K+ (b) levels were measured 24 h after acute or the last repeated Aβ treatment as described under Methods. White bars represent data for control i.e. untreated cells. Data are representative of 2 independent experiments (with different cells preparations) each performed in triplicate. The bars represent the mean ± SD.
Fig. 2
Fig. 2. Changes in ion levels and in the Na+/K+ ATPase expression in astrocytes treated with Aβ 25–35
(a) Primary mouse astrocytes were either untreated (white bar) or exposed to acute (gray bar) or repeated (black bar) treatment with Aβ 25–35, and Na+ and K+ levels were measured 24 h after acute or the last repeated Aβ treatment as described under Methods. Data are the mean ± SD of 7 independent experiments. (b) Western blot analysis of Na+/K+ ATPase α1 subunit in astrocytes treated as in (a). The blot shown is representative of three independent experiments. (c) Quantification of Na+/K+ ATPase Westen blots data. Vertical bars show the relative expression of Na+/K+ ATPase α1 subunit in astrocytes treated as in (a). Data are mean ± SEM obtained in three independent experiments. Numbers above the horizontal lines show statistical significance of the difference between the corresponding vertical bars.
Fig. 3
Fig. 3. Effects of ouabain inhibition of Na+/K+ ATPase on intracellular cation levels in astrocytes treated with Aβ 25–35
Primary murine astrocytes were cultured without Aβ (white bars) or repeatedly treated with 50 μM Aβ 25–35 (grey bars) as described under Methods. Ouabain was added to the incubation medium to a final concentration of 500 μM at the time of the last treatment with Aβ. Intracellular (a) Na+ and (b) K+ levels were measured 24 h later as described under Methods. Data are the mean ± SD (n=3).
Fig. 4
Fig. 4. Changes in expression of excitatory amino acid transporters (GLAST and GLT-1) in astrocytes treated with Aβ 25–35
(a) Primary mouse astrocytes were cultured without treatment, or treated with 50 μM Aβ 25–35 acutely or repeatedly as described under Methods. Western blot analysis of GLAST and GLT-1 levels in the cells was done 24 h after acute or the last repeated Aβ treatment. Quantification of GLAST (b) and GLT-1 (c) Western blot data. The vertical bars represent the GLAST and GLT-1 protein expression levels relative to the untreated controls (white bar) versus acute (grey bar) or repeated (black bar) Aβ-treated cells. For GLT-1, the bars represent the sum of the intensity of the two bands corresponding to the transporter. The Western blot in (a) is representative of two independent experiments and the data in (b) and (c) are mean ± SEM obtained in 2 (GLAST) and 3 (GLT-1) independent experiments. Numbers above the horizontal lines denote the statistical significance of the difference between the corresponding vertical bars.
Fig. 5
Fig. 5. Cell-specific effect of Aβ 25–35 on intracellular cation levels
Intracellular levels of (a) Na+ and (b) K+ were measured in human astrocytoma cells, U-87MG, human embryonic kidney cells, HEK 293 and human T cell leukemia (Jurkat) cells. Ion concentrations were measured in untreated controls (white bars), or in cells acutely treated with 50 μM Aβ 25–35 (grey bars) after 24 h as described under Methods. Cells were cultured and treated with Aβ 25–35 in 6-well plates at a cell density of 1–2×10⁶ cells/well as described under Methods. Data represent the mean ± SD; n=4 and 2 for control and Aβ treated U-87GM cells, n=8 and 4 for control and Aβ treated HEK 293 cells, and n=4 and 2 for control and Aβ treated Jurkat cells respectively.
Fig. 6
Fig. 6. The effect of Aβ 1–40 on intracellular levels of Na+ and K+ in primary mouse astrocytes
Cells were cultured without Aβ treatment (control, white bars) or were acutely treated with 10 or 50 μM of Aβ 1–40 (black bars). Intracellular Na+ (a) and K+ (b) levels were measured 24 h after Aβ treatment as described under Methods. Data represent the mean ± SD of two independent experiments each performed in triplicate. Numbers above the horizontal lines show statistical significance of the difference between corresponding vertical bars.
Fig. 7
Fig. 7. Modeled dependence of total tissue potassium concentration on total tissue sodium concentration in samples with different relative intracellular volumes
Graphs were plotted using equations (3) and (4) at extracellular [Na+] = 147 mM and [K+] = 2.8 mM and (a) at intracellular Kin = 110 mM and intracellular Nain of 5, 10, 20, and 40 mM, and (b) at intracellular Nain = 10 mM and intracellular Kin of 100, 110, 120, and 130 mM. Symbols indicate data points with different relative intracellular volumes from 1.0 to 0.0 in 0.1 increments. The point with the lowest Kt value and highest Nat value corresponds to extracellular [Na+] = 147 mM and [K+]=2.8 mM (relative intracellular volume = 0.0). The points with the highest Kt values show intracellular concentrations of Na+ and K+ when the relative intracellular volume = 1.0.
Fig. 8
Fig. 8. Comparison of Na+ and K+ ion concentrations in brain tissue from AD patients versus matched controls
Na+ and K+ ion concentrations were measured in brain homogenates of frontal cortex (FC), parietal cortex (PC) and cerebellum (Cb) from AD (open circles, n=16) and normal (control) (black circles, n=12) subjects. Data were normalized to the amount of tissue. Symbols show individual data and the solid and dashed lines represent the linear fits to the control and AD data points, respectively.

References

    1. Mattson MP. Pathways towards and away from Alzheimer’s disease. Nature. 2004;430:631–639. - PMC - PubMed
    1. Pike CJ, Cummings BJ, Monzavi R, Cotman CW. Beta-amyloid-induced changes in cultured astrocytes parallel reactive astrocytosis associated with senile plaques in Alzheimer’s disease. Neuroscience. 1994;63:517–531. - PubMed
    1. Butterfield DA, Drake J, Pocernich C, Castegna A. Evidence of oxidative damage in Alzheimer’s disease brain: central role for amyloid beta-peptide. Trends Mol Med. 2001;7:548–554. - PubMed
    1. Lauderback CM, Hackett JM, Huang FF, Keller JN, Szweda LI, Markesbery WR, Butterfield DA. The glial glutamate transporter, GLT-1, is oxidatively modified by 4-hydroxy-2-nonenal in the Alzheimer’s disease brain: the role of Abeta1–42. J Neurochem. 2001;78:413–416. - PubMed
    1. Hattori N, Kitagawa K, Higashida T, Yagyu K, Shimohama S, Wataya T, Perry G, Smith MA, Inagaki C. CI-ATPase and Na+/K(+)-ATPase activities in Alzheimer’s disease brains. Neurosci Lett. 1998;254:141–144. - PubMed

Publication types

MeSH terms