. 2012 Sep;13(9):851-6.
doi: 10.1038/ni.2371. Epub 2012 Jul 22.

Type II natural killer T cells use features of both innate-like and conventional T cells to recognize sulfatide self antigens

Affiliations

Type II natural killer T cells use features of both innate-like and conventional T cells to recognize sulfatide self antigens

Enrico Girardi et al. Nat Immunol. 2012 Sep.

Abstract

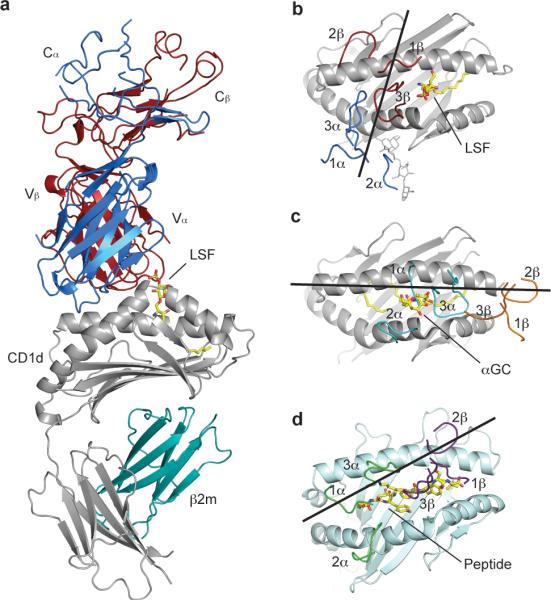
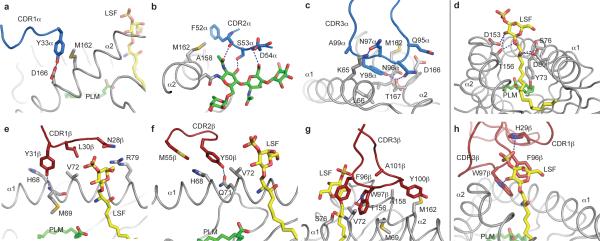
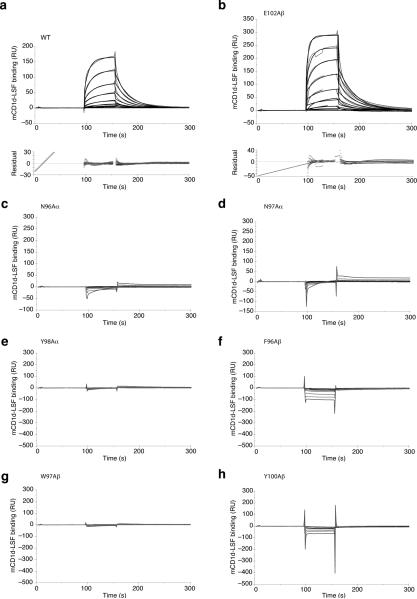
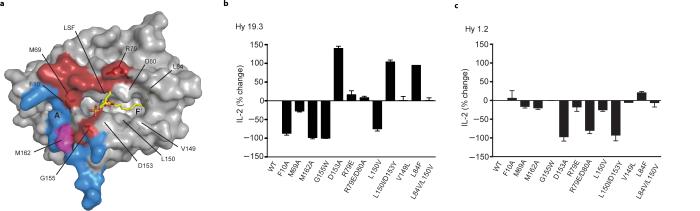
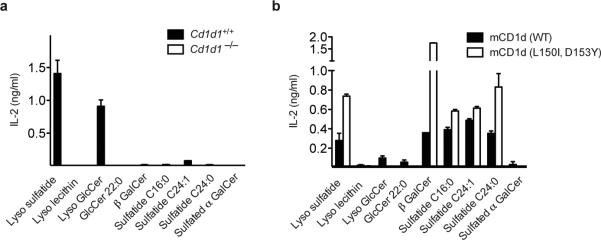
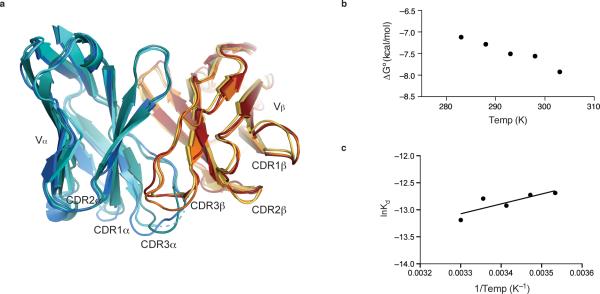
Glycolipids presented by the major histocompatibility complex (MHC) class I homolog CD1d are recognized by natural killer T cells (NKT cells) characterized by either a semi-invariant T cell antigen receptor (TCR) repertoire (type I NKT cells or iNKT cells) or a relatively variable TCR repertoire (type II NKT cells). Here we describe the structure of a type II NKT cell TCR in complex with CD1d-lysosulfatide. Both TCR α-chains and TCR β-chains made contact with the CD1d molecule with a diagonal footprint, typical of MHC-TCR interactions, whereas the antigen was recognized exclusively with a single TCR chain, similar to the iNKT cell TCR. Type II NKT cell TCRs, therefore, recognize CD1d-sulfatide complexes by a distinct recognition mechanism characterized by the TCR-binding features of both iNKT cells and conventional peptide-reactive T cells.


Figures

Figure 1
Figure 1. Overall structure and docking orientation of the Hy19.3 TCR on the CD1d-LSF complex
a, Crystal structure of the mouse CD1d-LSF-Hy19.3 TCR with CD1d in grey, β2-microglobulin in aqua, TCR α chain in blue and TCR β chain in dark red. The ligand is shown in yellow. b-d, TCR footprint and binding orientation observed for the CD1d-LSF-Hy19.3 TCR complex (b), the CD1d-αGalCer-iNKT TCR complex (c, PDB code 3HE6) and an MHCI-peptide-TCR complex (d, PDB code 2CKB). The lines represent the vector connecting the centroids of the conserved disulphide bond present in each V domain. Note how the Hy19.3 TCR docks on CD1d with an almost perpendicular orientation (b), in stark contrast to the parallel docking of the iNKT TCR on the same antigen-presenting molecule (c).
Figure 2
Figure 2. The CD1d-antigen-TCR interface
a-c, Contacts between the TCR α chain CDR loops (in blue) and CD1d (grey). d, Contacts between CD1d (grey) and LSF (yellow). e-g, Contacts between CD1d (grey) and the TCR β chain CDR loops (dark red). h, Recognition of LSF (yellow) by the Hy19.3 TCR CDR1β and CDR3β loops (dark red). The spacer lipid in the A’ pocket (PLM) is shown in green. b, The N-linked glycosylation (green) at Asn165 of CD1d is shown contacting the CDR2α loop. Polar contacts are shown as dashed blue lines.
Figure 3
Figure 3. Effect of TCR mutations on binding affinity as measured by SPR
a Binding response of increasing concentrations (0.3-22 μm) of mCD1d-LSF complexes to immobilized WT TCR as measured by surface plasmon resonance. The response shown is reference-substracted. Binding of mCD1d-lysosulfatide is shown with the calculated fit as black lines and the corresponding residuals in the plot below. The diagonal line at the early time points in the residual plot is the result of a known software bug and it should be ignored. Kd WT = 5.98 ± 4.73 μM, ka WT = 6.0 ± 1.3 × 10³ M-1 s-1, kd WT = 0.033 ± 0.006 s-1. b-h Binding response of increasing concentrations (0.3-36 μm) of mCD1d-LSF complexes to immobilized CDR3α and CDR3β mutant TCRs. Note how all the mutants but the control mutation at position 102 of CDR3β were unable to elicit measurable responses. Kd E102Aβ = 6.65 ± 3.18 μM, ka E102Aβ = 4.9 ± 2.0 × 10³ M-1 s-1, kd E102Aβ = 0.029 ± 0.003 s-1. Values represent average and standard deviation of at least two independent measurements.
Figure 4
Figure 4. Mutation of CD1d residues at the interface affects activation of the Hy19.3 hybridoma
a Localization of the CD1d mutated residues at the CD1d-TCR interface. CD1d is shown as grey surface with the residues comprising the α or β chain footprint on CD1d shown in blue and dark red, respectively. The only shared residue between the two footprints (Met162) is shown in magenta. LSF is shown in yellow. b-c Relative changes in the amount of IL-2 release, a measure of hybridoma activation, by the Hy19.3 line (b) or the iNKT hybridoma line Hy1.2 (c) in a coated plate assay when stimulated with different CD1d mutants loaded with either LSF (2 μg/ml, Hy19.3) or αGalCer (0.5 μg/ml, Hy1.2). The antigen concentration used represents the optimal concentration determined by antigen titration. The results are representative of at least five independent experiments.
Figure 5
Figure 5. Recognition of self-lipids by the Hy19.3 TCR in a plate-bound assay
a A typical NKT cell stimulation assay in the presence of APC (splenocytes) from either wild-type (Cd1d1+/+) or CD1d-knockout mice (Cd1d1-/-). A concentration of 2.5 μg/ml of each antigen was used. b APC-free CD1d-coated plate assay using recombinant WT mCD1d and the mutant L150I,D153Y mCD1d. The data are representative of three independent experiments.
Figure 6
Figure 6. Flexibility in the CDR loops of the Hy19.3 TCR
a, Superposition of the complexed and uncomplexed TCR structures showing the V domain of α (complexed in blue, uncomplexed in cyan and aqua) and β (complexed in dark red, uncomplexed in orange and yellow) chains. Flexibility is observed for CDR1α, CDR2β and most notably both CDR3 loops. The disordered portion of the CDR3α loop in one of the uncomplexed TCRs is shown as a dashed line. b Plot of free energy (ΔG) values against temperature. The values represent the average of two independent experiments. c van't Hoff analysis of Hy19.3 TCR binding to mCD1d-LSF. The enthalpic and entropic energetic contributions to the complex formation were estimated by linear regression of data from a van't Hoff plot yielding ΔH = 3.63 ± 3.58 kcal/mol and TΔS@25°C = 11.28 ± 3.65 kcal/mol. The binding of the Hy19.3 TCR is entropically driven, possibly as a result water displacement and/or the formation of hydrophobic interactions upon complex formation.

Comment in

References

    1. Godfrey DI, Macdonald HR, Kronenberg M, Smyth MJ, Van Kaer L. NKT cells: what's in a name? Nat. Rev. Immunol. 2004;4:231–237. - PubMed
    1. Godfrey DI, Rossjohn J, Mccluskey J. The fidelity, occasional promiscuity, and versatility of T cell receptor recognition. Immunity. 2008;28:304–314. - PubMed
    1. Zajonc D, Wilson IA. Architecture of CD1 proteins. Curr. Top. Microbiol. Immunol. 2007;314:27–50. - PubMed
    1. Borg NA, et al. CD1d-lipid-antigen recognition by the semi-invariant NKT T-cell receptor. Nature. 2007;448:44–49. - PubMed
    1. Pellicci DG, et al. Recognition of β-linked self glycolipids mediated by natural killer T cell antigen receptors. Nat. Immunol. 2011;12:827–834. - PMC - PubMed

Publication types

MeSH terms