

Automated analysis of small animal PET studies through deformable registration to an atlas
- PMID: 22820650
- PMCID: PMC3464388
- DOI: 10.1007/s00259-012-2188-7
Automated analysis of small animal PET studies through deformable registration to an atlas
Abstract
Purpose: This work aims to develop a methodology for automated atlas-guided analysis of small animal positron emission tomography (PET) data through deformable registration to an anatomical mouse model.
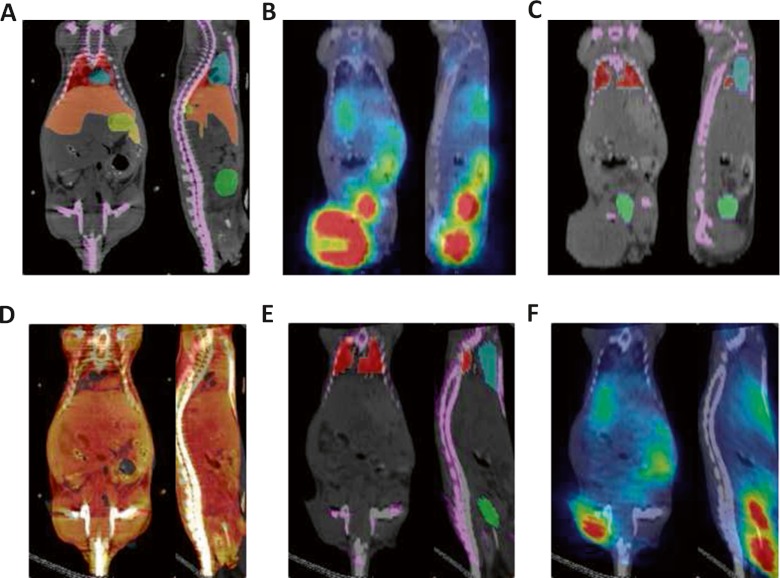
Methods: A non-rigid registration technique is used to put into correspondence relevant anatomical regions of rodent CT images from combined PET/CT studies to corresponding CT images of the Digimouse anatomical mouse model. The latter provides a pre-segmented atlas consisting of 21 anatomical regions suitable for automated quantitative analysis. Image registration is performed using a package based on the Insight Toolkit allowing the implementation of various image registration algorithms. The optimal parameters obtained for deformable registration were applied to simulated and experimental mouse PET/CT studies. The accuracy of the image registration procedure was assessed by segmenting mouse CT images into seven regions: brain, lungs, heart, kidneys, bladder, skeleton and the rest of the body. This was accomplished prior to image registration using a semi-automated algorithm. Each mouse segmentation was transformed using the parameters obtained during CT to CT image registration. The resulting segmentation was compared with the original Digimouse atlas to quantify image registration accuracy using established metrics such as the Dice coefficient and Hausdorff distance. PET images were then transformed using the same technique and automated quantitative analysis of tracer uptake performed.
Results: The Dice coefficient and Hausdorff distance show fair to excellent agreement and a mean registration mismatch distance of about 6 mm. The results demonstrate good quantification accuracy in most of the regions, especially the brain, but not in the bladder, as expected. Normalized mean activity estimates were preserved between the reference and automated quantification techniques with relative errors below 10 % in most of the organs considered.
Conclusion: The proposed automated quantification technique is reliable, robust and suitable for fast quantification of preclinical PET data in large serial studies.
Figures


Similar articles
-
A computational pipeline for quantification of pulmonary infections in small animal models using serial PET-CT imaging.EJNMMI Res. 2013 Jul 23;3(1):55. doi: 10.1186/2191-219X-3-55. EJNMMI Res. 2013. PMID: 23879987 Free PMC article.
-
Quantitative analysis of MRI-guided attenuation correction techniques in time-of-flight brain PET/MRI.Neuroimage. 2016 Apr 15;130:123-133. doi: 10.1016/j.neuroimage.2016.01.060. Epub 2016 Feb 4. Neuroimage. 2016. PMID: 26853602
-
One registration multi-atlas-based pseudo-CT generation for attenuation correction in PET/MRI.Eur J Nucl Med Mol Imaging. 2016 Oct;43(11):2021-35. doi: 10.1007/s00259-016-3422-5. Epub 2016 Jun 3. Eur J Nucl Med Mol Imaging. 2016. PMID: 27260522
-
A multi-atlas based method for automated anatomical Macaca fascicularis brain MRI segmentation and PET kinetic extraction.Neuroimage. 2013 Aug 15;77:26-43. doi: 10.1016/j.neuroimage.2013.03.029. Epub 2013 Mar 26. Neuroimage. 2013. PMID: 23537938
-
PET/CT imaging in mouse models of myocardial ischemia.J Biomed Biotechnol. 2012;2012:541872. doi: 10.1155/2012/541872. Epub 2012 Mar 13. J Biomed Biotechnol. 2012. PMID: 22505813 Free PMC article. Review.
Cited by
-
Evaluation of whole-body MR to CT deformable image registration.J Appl Clin Med Phys. 2013 Jul 8;14(4):4163. doi: 10.1120/jacmp.v14i4.4163. J Appl Clin Med Phys. 2013. PMID: 23835382 Free PMC article.
-
Automated MicroSPECT/MicroCT Image Analysis of the Mouse Thyroid Gland.Thyroid. 2017 Nov;27(11):1433-1440. doi: 10.1089/thy.2017.0264. Epub 2017 Oct 19. Thyroid. 2017. PMID: 28920557 Free PMC article.
-
Abdominal ultrasound stimulation alleviates DSS-induced colitis and behavioral disorders in mice by mediating the microbiota-gut-brain axis balance.Neurotherapeutics. 2025 Mar;22(2):e00494. doi: 10.1016/j.neurot.2024.e00494. Epub 2024 Nov 22. Neurotherapeutics. 2025. PMID: 39580323 Free PMC article.
-
Scatter characterization and correction for simultaneous multiple small-animal PET imaging.Mol Imaging Biol. 2014 Apr;16(2):199-209. doi: 10.1007/s11307-013-0683-2. Mol Imaging Biol. 2014. PMID: 23990147
-
Automated quantification of bioluminescence images.Nat Commun. 2018 Oct 15;9(1):4262. doi: 10.1038/s41467-018-06288-w. Nat Commun. 2018. PMID: 30323260 Free PMC article.
References
-
- Zaidi H, editor. Quantitative analysis in nuclear medicine imaging. New York: Springer; 2006.
-
- Casteels C, Vermaelen P, Nuyts J, Van Der Linden A, Baekelandt V, Mortelmans L, et al. Construction and evaluation of multitracer small-animal PET probabilistic atlases for voxel-based functional mapping of the rat brain. J Nucl Med. 2006;47:1858–1866. - PubMed
-
- Kesner AL, Dahlbom M, Huang SC, Hsueh WA, Pio BS, Czernin J, et al. Semiautomated analysis of small-animal PET data. J Nucl Med. 2006;47:1181–1186. - PubMed
Publication types
MeSH terms
LinkOut - more resources
Full Text Sources
Medical
