. 2012 Aug;19(8):754-9.
doi: 10.1038/nsmb.2348. Epub 2012 Jul 22.

Crystal structures of the JAK2 pseudokinase domain and the pathogenic mutant V617F

Affiliations

Crystal structures of the JAK2 pseudokinase domain and the pathogenic mutant V617F

Rajintha M Bandaranayake et al. Nat Struct Mol Biol. 2012 Aug.

Abstract

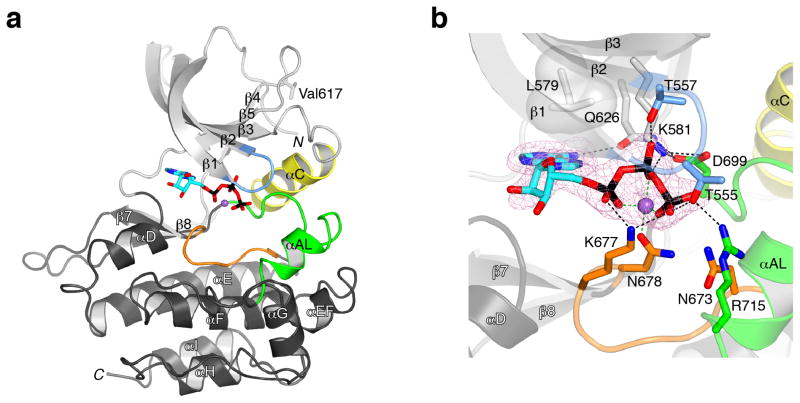
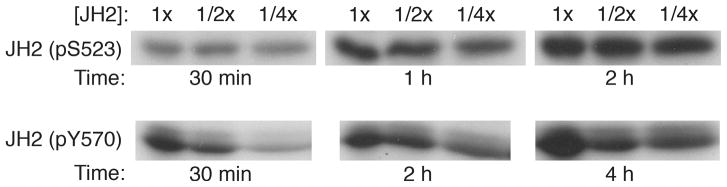
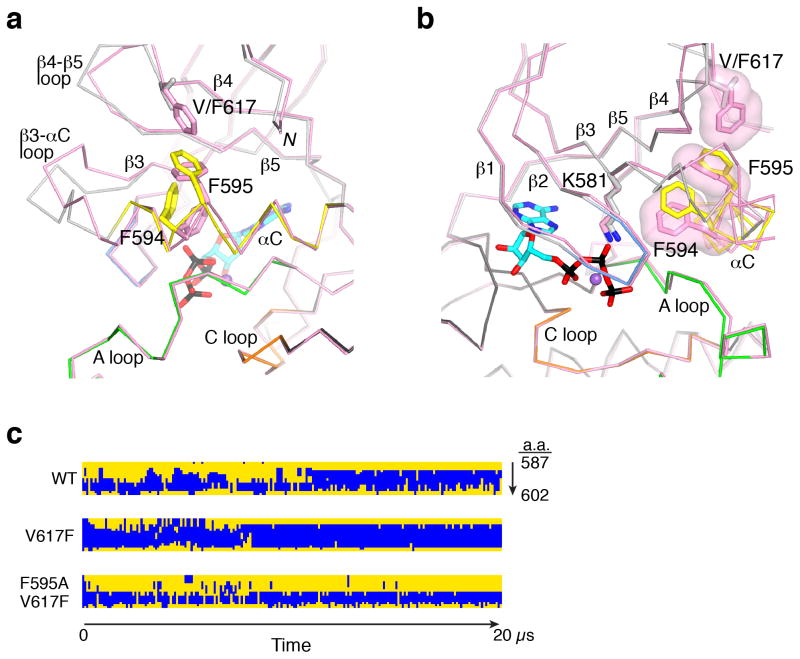
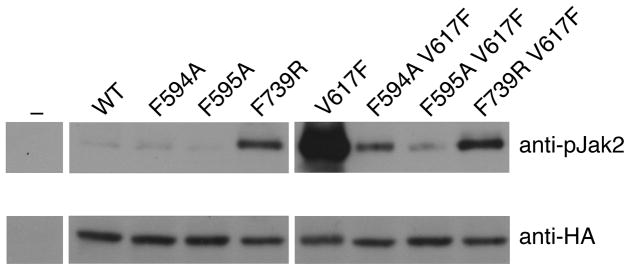
The protein tyrosine kinase JAK2 mediates signaling through numerous cytokine receptors. JAK2 possesses a pseudokinase domain (JH2) and a tyrosine kinase domain (JH1). Through unknown mechanisms, JH2 regulates the catalytic activity of JH1, and hyperactivating mutations in the JH2 region of human JAK2 cause myeloproliferative neoplasms (MPNs). We showed previously that JAK2 JH2 is, in fact, catalytically active. Here we present crystal structures of human JAK2 JH2, including both wild type and the most prevalent MPN mutant, V617F. The structures reveal that JH2 adopts the fold of a prototypical protein kinase but binds Mg-ATP noncanonically. The structural and biochemical data indicate that the V617F mutation rigidifies α-helix C in the N lobe of JH2, facilitating trans-phosphorylation of JH1. The crystal structures of JH2 afford new opportunities for the design of novel JAK2 therapeutics targeting MPNs.


Figures

Figure 1
Figure 1
Crystal structure of Jak2 JH2. (a) Ribbon diagram of the structure of JH2. The N lobe of JH2 is colored light gray expect for the nucleotide-binding loop (blue) and αC (yellow). The C lobe is colored dark gray except for the catalytic loop (orange) and the activation loop (green). The α helices and β strands are labeled (shown semi-transparent), as are the N- and C-termini (N and C). ATP is shown in stick representation and colored cyan (carbon), red (oxygen), blue (nitrogen) or black (phosphorus), and the Mg2+ ion is colored purple. The side chain of Val617, the site of the pathogenic mutation V617F (in the β4-β5 loop), is shown in stick representation. (b) Mode of ATP binding in JH2. The viewing angle is approximately the same as in a. Select side chains are shown, with carbon atoms colored according to the residue’s location, as in a (e.g., orange for catalytic loop). Superimposed is an electron density map (Fo-Fc, pink mesh, contoured at 3σ) computed without Mg-ATP in the model (but present during refinement). Hydrogen bonds and salt bridges are represented by black dashed lines, and Mg2+ coordination (≤2.1 Å) is represented by green dashed lines.
Figure 2
Figure 2
Cis- versus trans-autophosphorylation of Jak2 JH2. Autophosphorylation reactions were performed at three different JH2 concentrations (1/4x, most dilute), and aliquots were taken at the indicated time points. Equal amounts of protein were loaded in each lane for SDS-PAGE and autoradiography. Top: the starting sample is unphosphorylated JH2, which becomes phosphorylated at Ser523 (see ref. 19). Bottom: the starting sample is Ser523-phosphorylated JH2, which becomes phosphorylated at Tyr570.
Figure 3
Figure 3
Comparison of JH2 V617F and wild-type structures. (a) Cα trace comparing JH2-VF to JH2-WT in the N lobe. The view is approximately 90° from that in Fig. 1a, with the same coloring of secondary-structure elements for JH2-WT (e.g., yellow for αC). JH2-VF is colored pink. The side chains of Phe594, Phe595 and Val or Phe617 are shown in stick representation. Mg-ATP is represented as in Fig. 1a. The N-terminus (residue 536) is labeled N. The catalytic loop (C loop), the activation loop (A loop), αC and other select segments are labeled. (b) The view is rotated by 90° from that in a, and the molecular surfaces of Phe594, Phe595 and Phe617 are included. (c) Results of molecular dynamic simulations for wild-type (WT), V617F and F595A V617F JH2. The secondary-structure assignment for each residue in the αC region (amino acids (a.a.) 587–602), as given by DSSP, is plotted top-to-bottom as a function of simulation time (20 μs total). Residues in α-helical conformation are colored blue, and residues in all other conformations (e.g., coil, turn, 310 helix, etc.) are colored yellow.
Figure 4
Figure 4
Basal activation state of Jak2 mutants in mammalian cells. Lysates from transiently transfected (or not, ‘−’) γ2A cells were immunoprecipitated with anti-HA antibodies and immunoblotted with either anti-pJak2 (pY1007-1008) antibodies (top) or anti-HA antibodies (bottom; Jak2 expression control). These data are all from the same two blots.

References

    1. Ghoreschi K, Laurence A, O’Shea JJ. Janus kinases in immune cell signaling. Immunol Rev. 2009;228:273–287. - PMC - PubMed
    1. Levy DE, Darnell JE., Jr Stats: transcriptional control and biological impact. Nat Rev Mol Cell Biol. 2002;3:651–662. - PubMed
    1. Lucet IS, et al. The structural basis of Janus kinase 2 inhibition by a potent and specific pan-Janus kinase inhibitor. Blood. 2006;107:176–183. - PubMed
    1. Boggon TJ, Li Y, Manley PW, Eck MJ. Crystal structure of the Jak3 kinase domain in complex with a staurosporine analog. Blood. 2005;106:996–1002. - PMC - PubMed
    1. Williams NK, et al. Dissecting specificity in the Janus kinases: the structures of JAK-specific inhibitors complexed to the JAK1 and JAK2 protein tyrosine kinase domains. J Mol Biol. 2009;387:219–232. - PubMed

Publication types

MeSH terms