. 2012 Aug;19(8):845-52.
doi: 10.1038/nsmb.2345. Epub 2012 Jul 22.

Direct sequencing of Arabidopsis thaliana RNA reveals patterns of cleavage and polyadenylation

Affiliations

Direct sequencing of Arabidopsis thaliana RNA reveals patterns of cleavage and polyadenylation

Alexander Sherstnev et al. Nat Struct Mol Biol. 2012 Aug.

Abstract

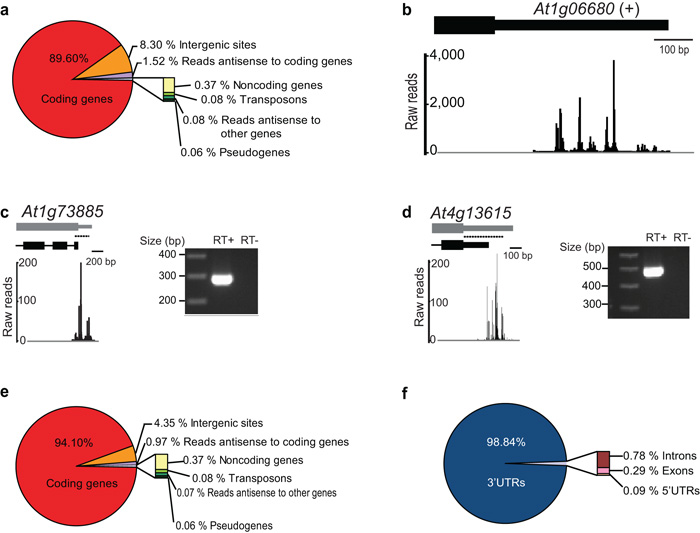
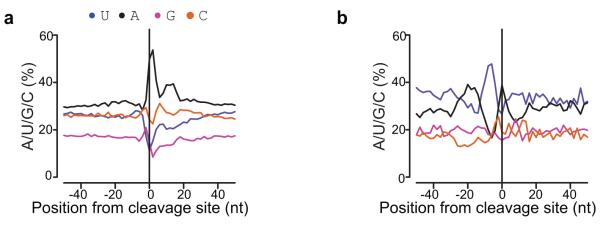
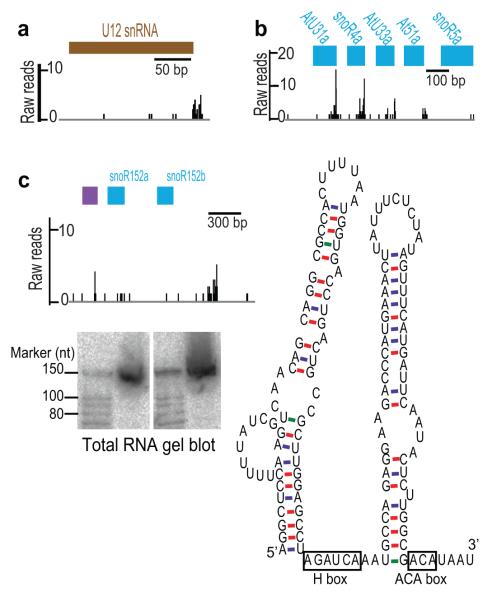
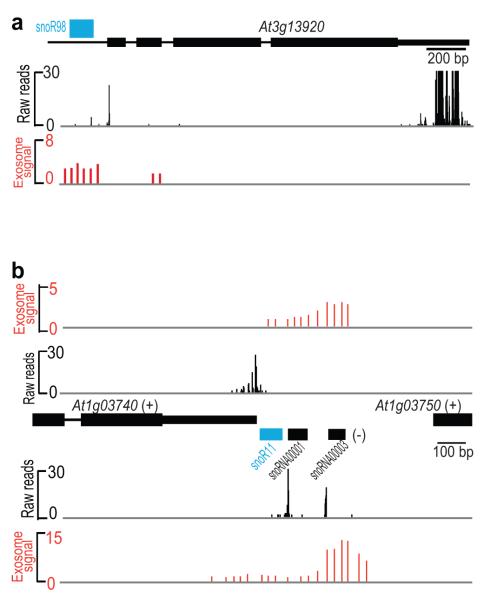
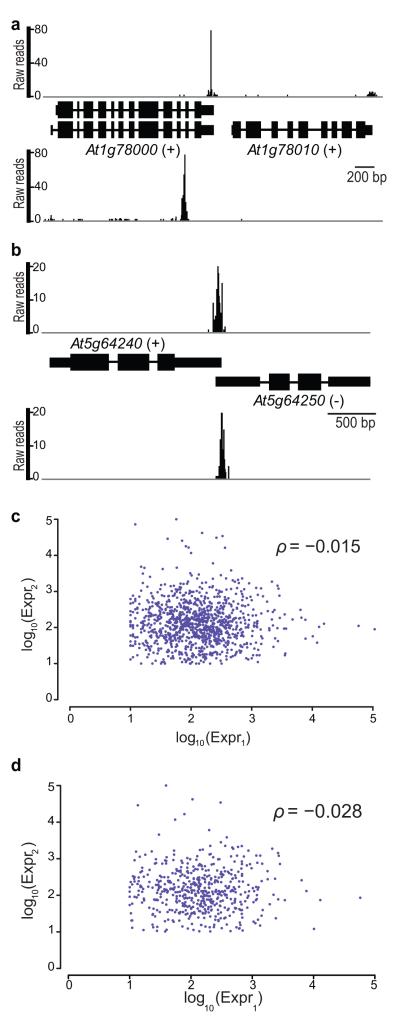
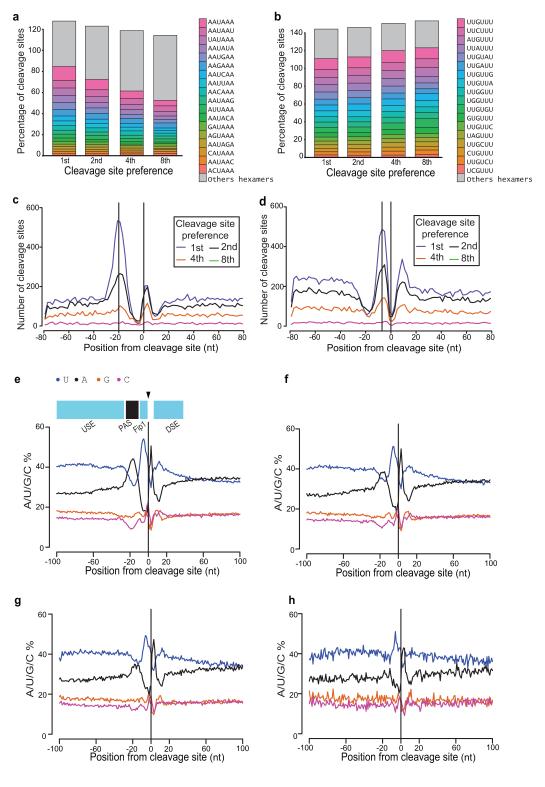
It has recently been shown that RNA 3'-end formation plays a more widespread role in controlling gene expression than previously thought. To examine the impact of regulated 3'-end formation genome-wide, we applied direct RNA sequencing to A. thaliana. Here we show the authentic transcriptome in unprecedented detail and describe the effects of 3'-end formation on genome organization. We reveal extreme heterogeneity in RNA 3' ends, discover previously unrecognized noncoding RNAs and propose widespread reannotation of the genome. We explain the origin of most poly(A)(+) antisense RNAs and identify cis elements that control 3'-end formation in different registers. These findings are essential to understanding what the genome actually encodes, how it is organized and how regulated 3'-end formation affects these processes.


Figures

Figure 1
Figure 1. Genome-Wide Patterns of A. thaliana RNA 3′ End Formation
(a) Genome-wide distribution of DRS reads before re-annotation. (b) Example of DRS alignment to an annotated 3′UTR showing extreme heterogeneity of cleavage sites. Exons are denoted by rectangles and UTRs by adjoining narrower rectangles. (c, d) comparison of TAIR10 (black) and proposed DRS-dependent (grey) annotations for At1g73885 (a previously undefined 3′UTR) and At4g13615 (an extended 3′UTR). RT-PCR with amplicons denoted by dashed lines shows evidence of contiguous RNAs. (e) Genome-wide distribution of DRS reads after re-annotation. (f) Distribution of DRS reads mapping to protein-coding genes after re-annotation.
Figure 2
Figure 2. Internal Priming is Rare or Absent in DRS
Nucleotide composition plots around proposed cleavage sites deduced from reads mapping to coding sequence exons reported by Wu at al. either without (a) or with (b) DRS confirmation. The 90.5% of sites without DRS support (a) show a nucleotide profile consistent with them being artifacts resulting from internal priming. In contrast, the 9.5% of sites with DRS support show an alternating pattern of A and U-rich sequence characteristic of A. thaliana 3′UTRs.
Figure 3
Figure 3. Identification of Un-annotated or Previously Undetected ncRNAs
(a) Reads mapping to the locus encoding U12 snRNA. (b) Reads mapping to a known snoRNA cluster. (c) SnoSeeker-predicted H/ACA snoRNA (purple) found in the known snoR152a/snoR152b (blue) cluster and validated by RNA gel blot analysis. The secondary structure prediction (ViennaRNA-1.8.4), and the position of box H and ACA sequences consistent with this class of snoRNA are indicated.
Figure 4
Figure 4. Identification of ncRNAs at Sites Affected by the Exosome
(a) Comparison of DRS reads (black) with exosome knockdown array data (red) for the At3g13920 open reading frame, suggested to be regulated by the exosome, which also encodes a known but un-annotated snoRNA (blue). (b) Comparison of DRS reads (black) with exosome knockdown array data (red) showing differences in strand specificity. The previously proposed role of the exosome in controlling 3′ end formation at At1g03740 may now be explained by processing of snoRNAs that are not annotated (blue) or annotated (black) in TAIR10 on the other strand and artifacts resulting from reverse transcriptase and tiling arrays.
Figure 5
Figure 5. Most Antisense Expression Derives from Convergent Gene Pairs with Overlapping 3′UTRs
(a) Example of intergenic DRS reads mapping antisense to a coding gene. The upper panel shows reads mapping to the (+) strand 3′ end of At1g78000 and At1g78010, while the lower panel shows intergenic reads (i.e. reads that don’t align to an annotated genome feature) antisense to At1g78000. (b) Example of reads mapping to 3′UTRs of a convergent overlapping gene pair. (c) Scatterplot of coding gene log10 expression for all convergent gene pairs in TAIR10 with 10 or more reads per gene. The Spearman correlation coefficient (ρ = −0.015) shows no evidence of anti-correlated expression. (d) Scatterplot of coding gene log10 expression for all convergent gene pairs with overlap detected by our peak finding algorithm (524 pairs). The Spearman correlation coefficient (ρ = −0.028) also shows no evidence of anti-correlated expression.
Figure 6
Figure 6. Cis-Element Analysis at Cleavage Sites
(a,b) Fraction of cleavage sites with AAUAAA-like and UUGUUU-like hexamers found within a 50-nucleotide region upstream: (a) AAUAAA and 17 single point mutation hexamers (AAAAAA excluded); (b) UUGUUU and 17 single point mutation hexamers (UUUUUU excluded). The total sum of all fractions exceeds 100% because some cleavage sites have more than one such hexamer within the upstream region. The cleavage sites are classified by preference of usage: 1st (most preferred, i.e. corresponding to the site with largest amount of DRS reads mapped to it) through to 8th (least preferred) in a given 3′UTR. (c) Distribution of AAUAAA-like motifs relative to preferred cleavage site. (d) Distribution of UUGUUU-like motifs relative to preferred cleavage site. (e-h) Nucleotide composition profiles around cleavage sites ranked by preference of usage: 1st (most preferred) through to 8th (least preferred) indicating that preferred and non-preferred sites in a 3′UTR are associated with different sequences. The proposed designation of alternating U- and A-rich sequences at preferred cleavage sites is shown in (e): USE (upstream sequence element), PAS (poly(A) signal), the U-rich sequencing upstream of the cleavage site has been proposed to be the binding site of FIP1 and while this remains to be clearly established this labeling is useful for distinguishing different U-rich sequences, DSE (downstream sequence element).
Figure 7
Figure 7. Multifunctional Cis-Elements within the Same 3′UTR
(a) Distance between cleavage sites in the same 3′UTR with peaks in distribution of adjacent sites marked by colored bands. (b) Nucleotide composition plots for adjacent sites located 15–20 nucleotides (left plot) or 35–40 nucleotides (right plot) apart. (c) Distance between cleavage sites in sense and antisense 3′UTRs of convergent gene pairs with peaks in distribution of adjacent sites marked by colored bands. (d) Nucleotide composition plots for adjacent sense and antisense cleavage sites peaking at −25 to −15 nucleotides (left plot) or−6 to +4 nucleotides (right plot).

References

    1. Di Giammartino DC, Nishida K, Manley JL. Mechanisms and consequences of alternative polyadenylation. Mol. Cell. 2011;43:853–66. - PMC - PubMed
    1. Proudfoot NJ. Ending the message: poly(A) signals then and now. Genes Dev. 2011;25:1770–82. - PMC - PubMed
    1. Hornyik C, Terzi LC, Simpson GG. The spen family protein FPA controls alternative cleavage and polyadenylation of RNA. Dev. Cell. 2010;18:203–13. - PubMed
    1. Greger IH, Proudfoot NJ. Poly(A) signals control both transcriptional termination and initiation between the tandem GAL10 and GAL7 genes of Saccharomyces cerevisiae. EMBO J. 1998;17:4771–9. - PMC - PubMed
    1. Gullerova M, Moazed D, Proudfoot NJ. Autoregulation of convergent RNAi genes in fission yeast. Genes Dev. 2011;25:556–68. - PMC - PubMed

Publication types

MeSH terms