. 2012 Dec;29(12):3767-80.
doi: 10.1093/molbev/mss179. Epub 2012 Jul 19.

Evolution of viral proteins originated de novo by overprinting

Affiliations

Evolution of viral proteins originated de novo by overprinting

Niv Sabath et al. Mol Biol Evol. 2012 Dec.

Abstract

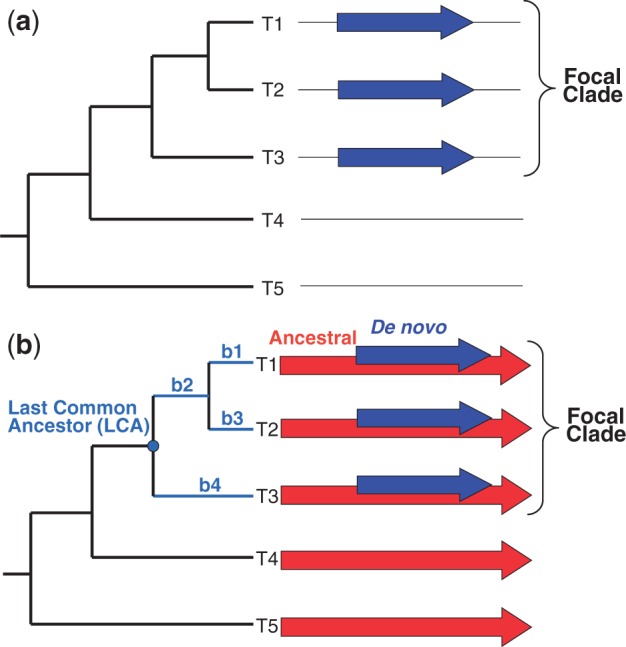
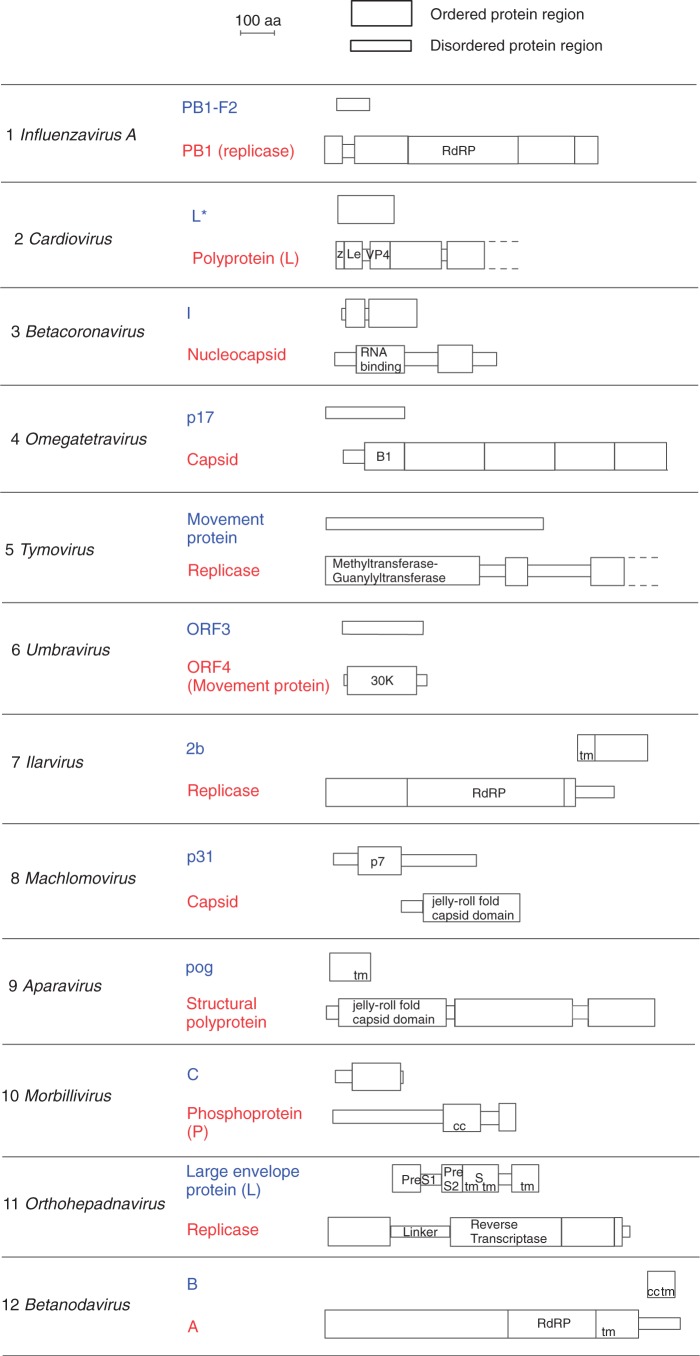
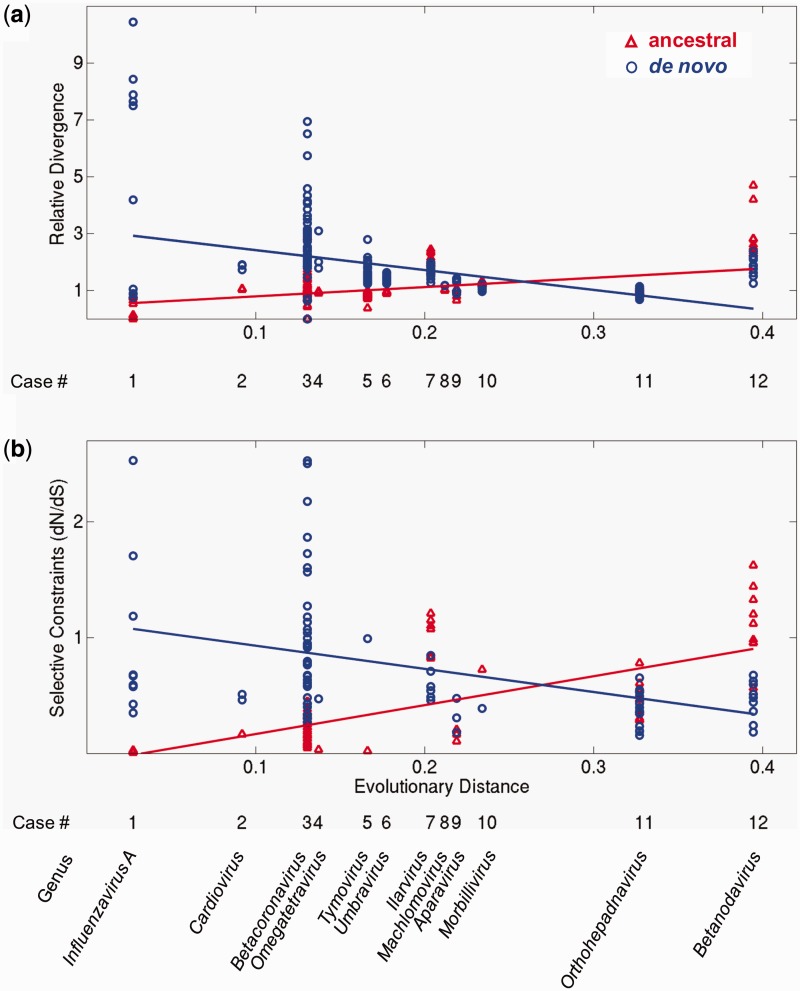
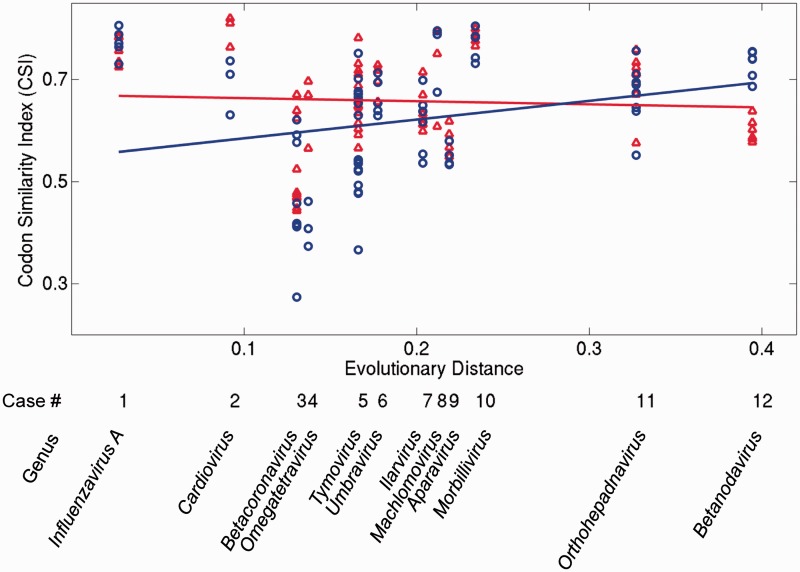
New protein-coding genes can originate either through modification of existing genes or de novo. Recently, the importance of de novo origination has been recognized in eukaryotes, although eukaryotic genes originated de novo are relatively rare and difficult to identify. In contrast, viruses contain many de novo genes, namely those in which an existing gene has been "overprinted" by a new open reading frame, a process that generates a new protein-coding gene overlapping the ancestral gene. We analyzed the evolution of 12 experimentally validated viral genes that originated de novo and estimated their relative ages. We found that young de novo genes have a different codon usage from the rest of the genome. They evolve rapidly and are under positive or weak purifying selection. Thus, young de novo genes might have strain-specific functions, or no function, and would be difficult to detect using current genome annotation methods that rely on the sequence signature of purifying selection. In contrast to young de novo genes, older de novo genes have a codon usage that is similar to the rest of the genome. They evolve slowly and are under stronger purifying selection. Some of the oldest de novo genes evolve under stronger selection pressure than the ancestral gene they overlap, suggesting an evolutionary tug of war between the ancestral and the de novo gene.


Figures

F<sc>ig</sc>. 1.
Fig. 1.
Monophyletic distribution of genes originated de novo. (a) A gene that originated de novo (blue arrows) will exhibit a monophyletic distribution among related taxa. However, this distribution could also be the result of divergence of the gene beyond recognition or of acquisition of the gene through horizontal gene transfer (HGT). (b) For a gene that originated de novo (blue arrows) by overprinting an ancestral reading frame (red arrows), these confounding factors can be excluded (see Introduction). Colors are displayed in the electronic version of the article.
F<sc>ig</sc>. 2.
Fig. 2.
Structural and functional organization of the overlapping genes we studied. Proteins encoded by overlapping genes are shown to scale. For each protein pair, the ancestral protein is shown on the bottom and the de novo protein on top. B1, base domain 1; cc, coiled coil; Le, Leader region; PA2, phospholipase A2 domain; RdRP, RNA-dependent RNA polymerase domain; tm, transmembrane segment; z, zinc-binding region.
F<sc>ig</sc>. 3.
Fig. 3.
Evolutionary dynamics of ancestral (red) and de novo genes (blue). The vertical axes show (a) relative divergence and (b) selective constraint (dN/dS) for the 12 taxa. The horizontal axis represents the evolutionary distance from the origin of each de novo gene (i.e., the estimated age of genes within the clade). Regression lines are plotted for visualization of general trends. Low dN/dS values represent strong selective constraints (see text). Note that dN/dS in (b) could only be calculated for gene pairs that have less than 50% amino acid divergence at the amino acid level (see Materials and Methods). No selective constraint data could be calculated for cases 6 and 8 (bottom panel) as the sequence pairs in these clades have all diverged beyond 50%. Where neighboring groups had similar ages, we shifted their position slightly for visual clarity (groups 5 and 6).
F<sc>ig</sc>. 4.
Fig. 4.
Codon Similarity Index (CSI) of ancestral (red) and de novo genes (blue). The horizontal axis represents the evolutionary distance from the origin of each de novo gene (as in fig. 3). Regression lines are plotted for visualization of general trends. High CSI values indicate high similarity between the codon usage of a gene and the codon usage of the rest of a genome. Colors are displayed in the electronic version of the paper.

References

    1. Abroi A, Gough J. Are viruses a source of new protein folds for organisms?—virosphere structure space and evolution. Bioessays. 2011;33:626–635. - PubMed
    1. Altschul SF, Madden TL, Schaffer AA, Zhang J, Zhang Z, Miller W, Lipman DJ. Gapped BLAST and PSI-BLAST: a new generation of protein database search programs. Nucleic Acids Res. 1997;25:3389–3402. - PMC - PubMed
    1. Anisimova M, Kosiol C. Investigating protein-coding sequence evolution with probabilistic codon substitution models. Mol Biol Evol. 2009;26:255–271. - PubMed
    1. Babushok DV, Ostertag EM, Kazazian HH. Current topics in genome evolution: molecular mechanisms of new gene formation. Cellular Mol Life Sci. 2007;64:542–554. - PMC - PubMed
    1. Bao Y, Federhen S, Leipe D, Pham V, Resenchuk S, Rozanov M, Tatusov R, Tatusova T. National center for biotechnology information viral genomes project. J Virol. 2004;78:7291–7298. - PMC - PubMed

Publication types