

Patient-derived luminal breast cancer xenografts retain hormone receptor heterogeneity and help define unique estrogen-dependent gene signatures
- PMID: 22821401
- PMCID: PMC3818141
- DOI: 10.1007/s10549-012-2164-8
Patient-derived luminal breast cancer xenografts retain hormone receptor heterogeneity and help define unique estrogen-dependent gene signatures
Abstract
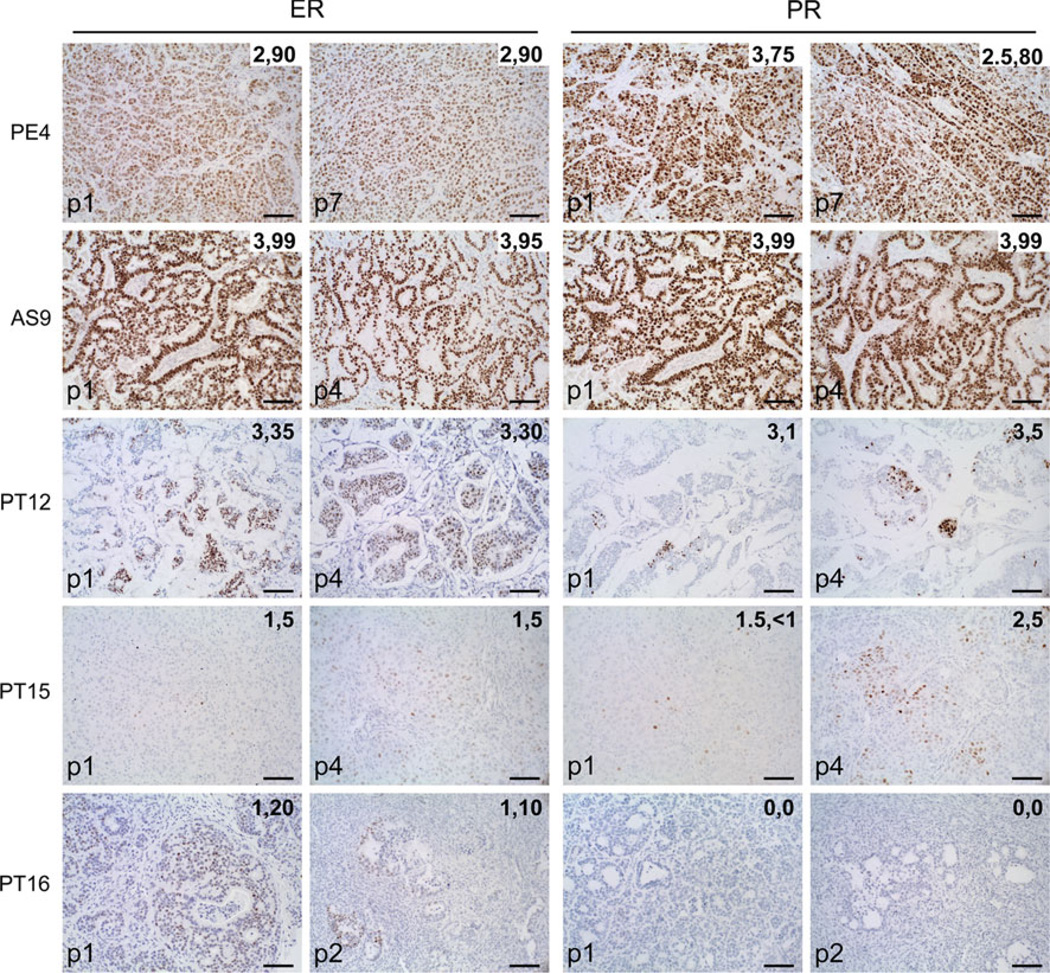
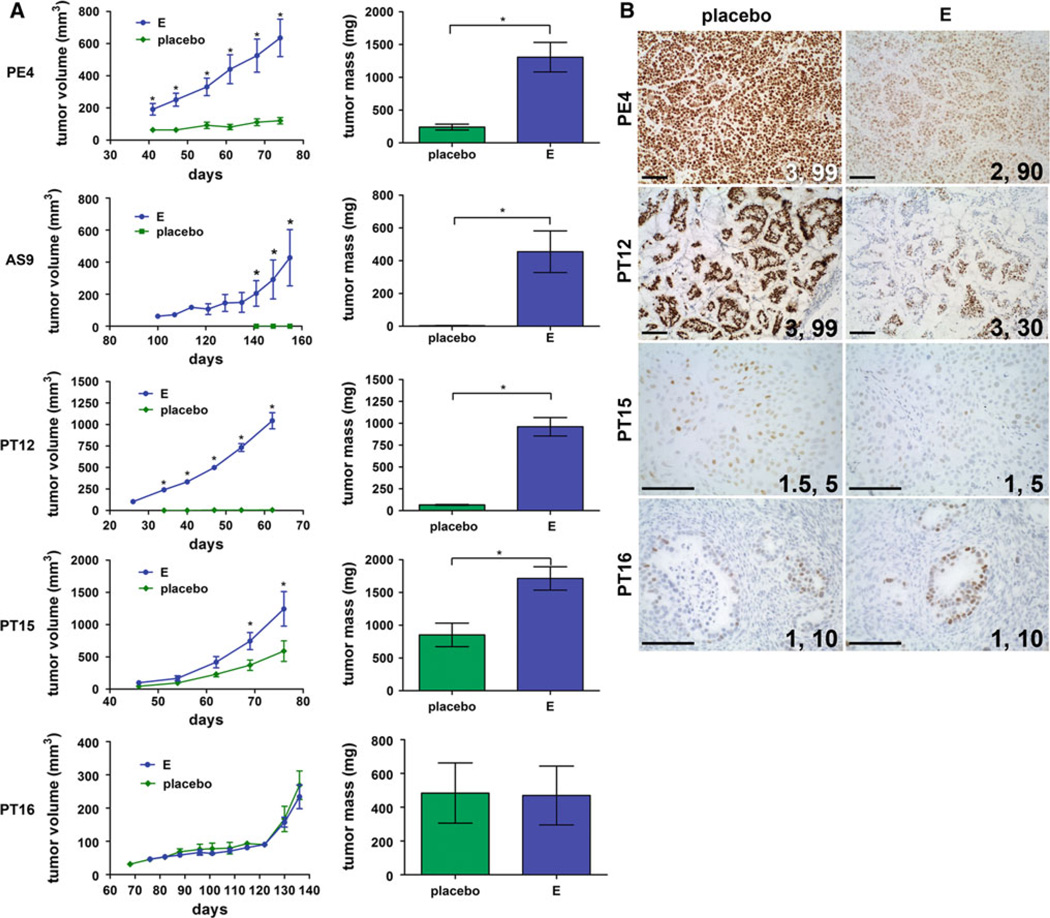
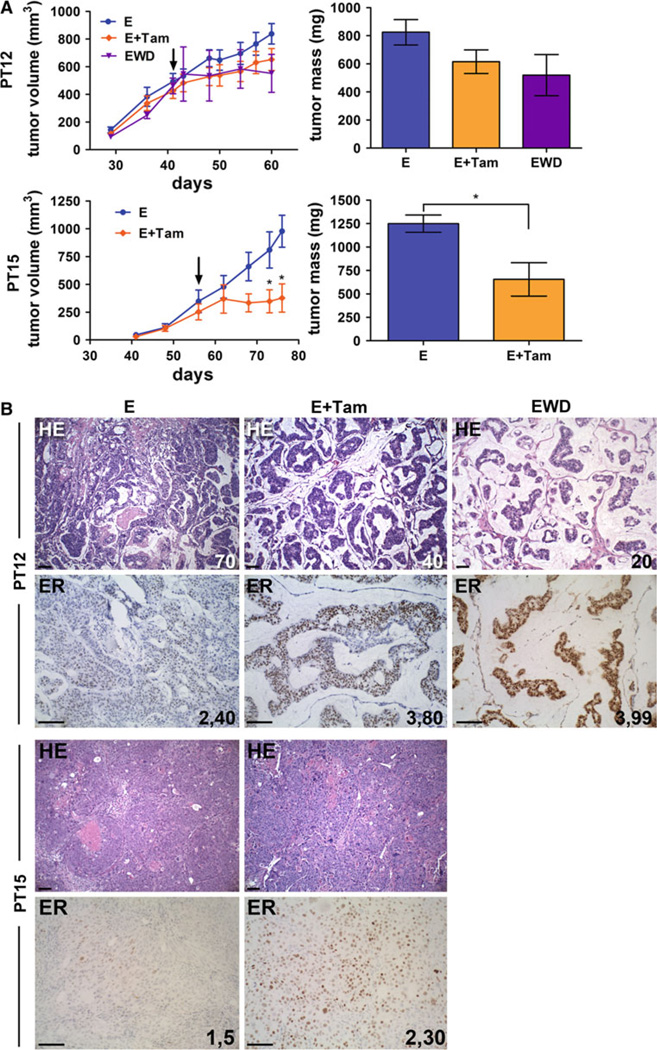
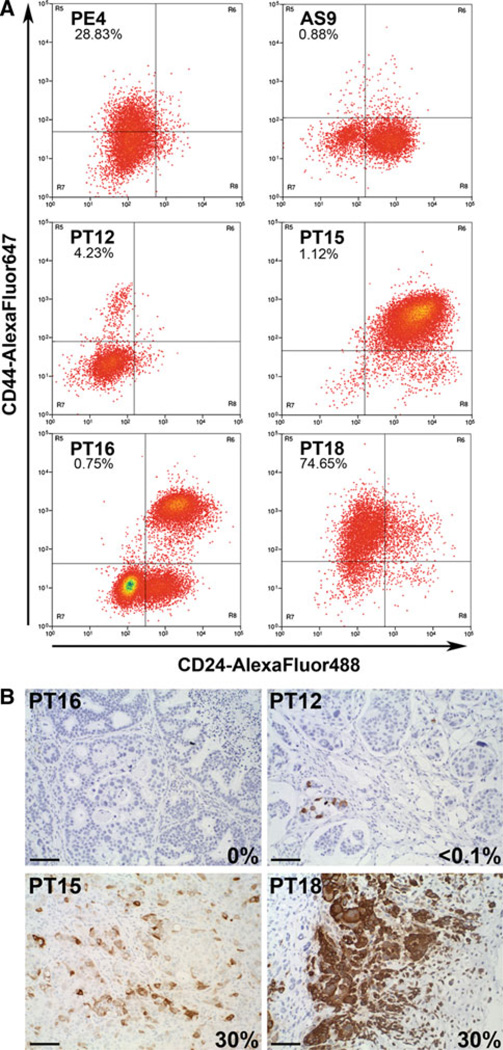
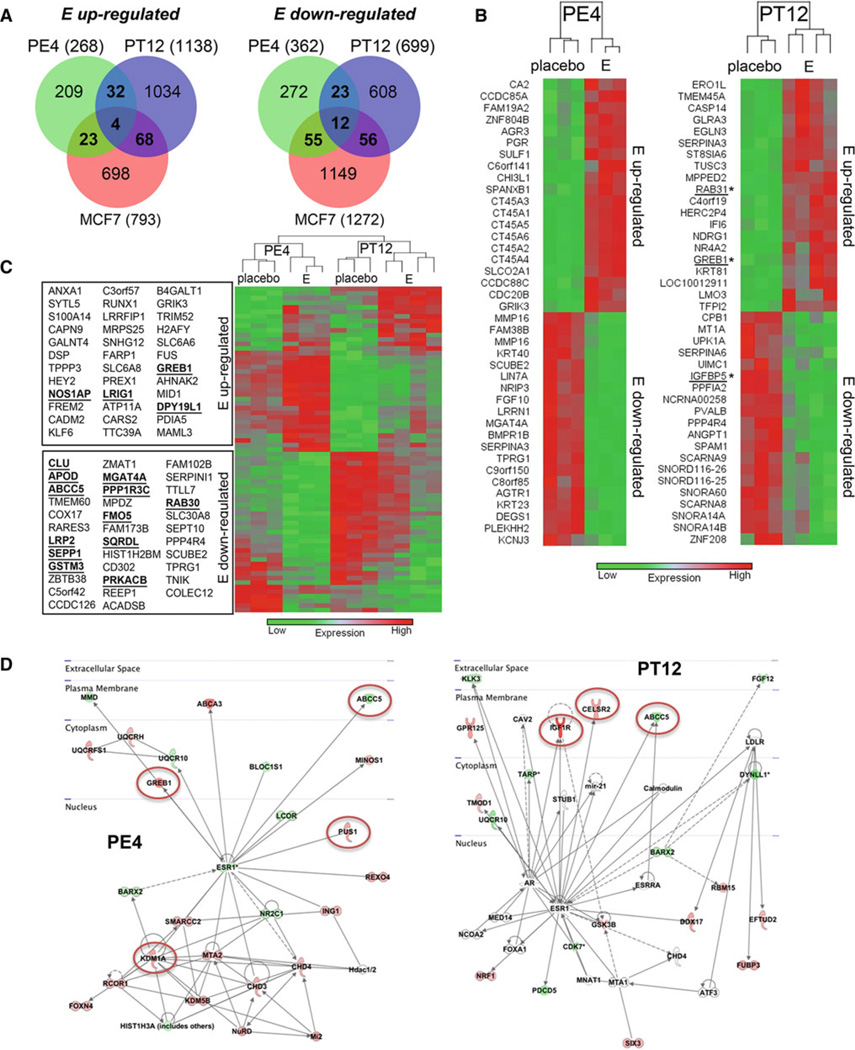
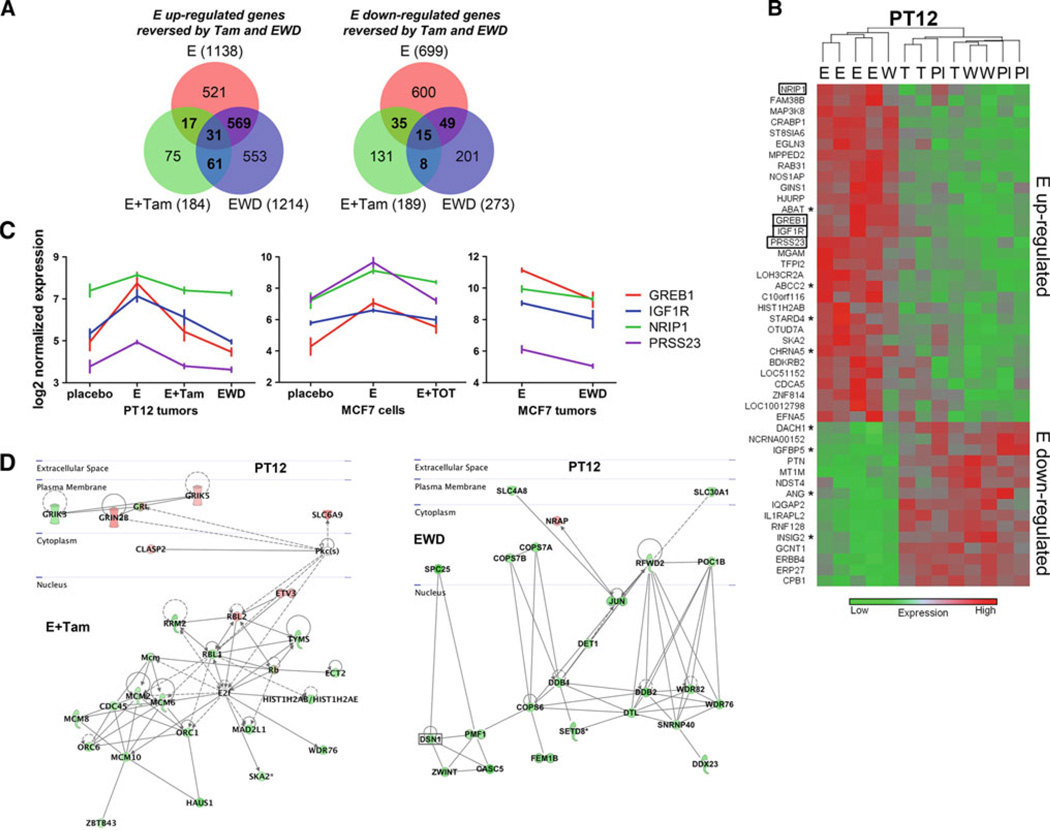
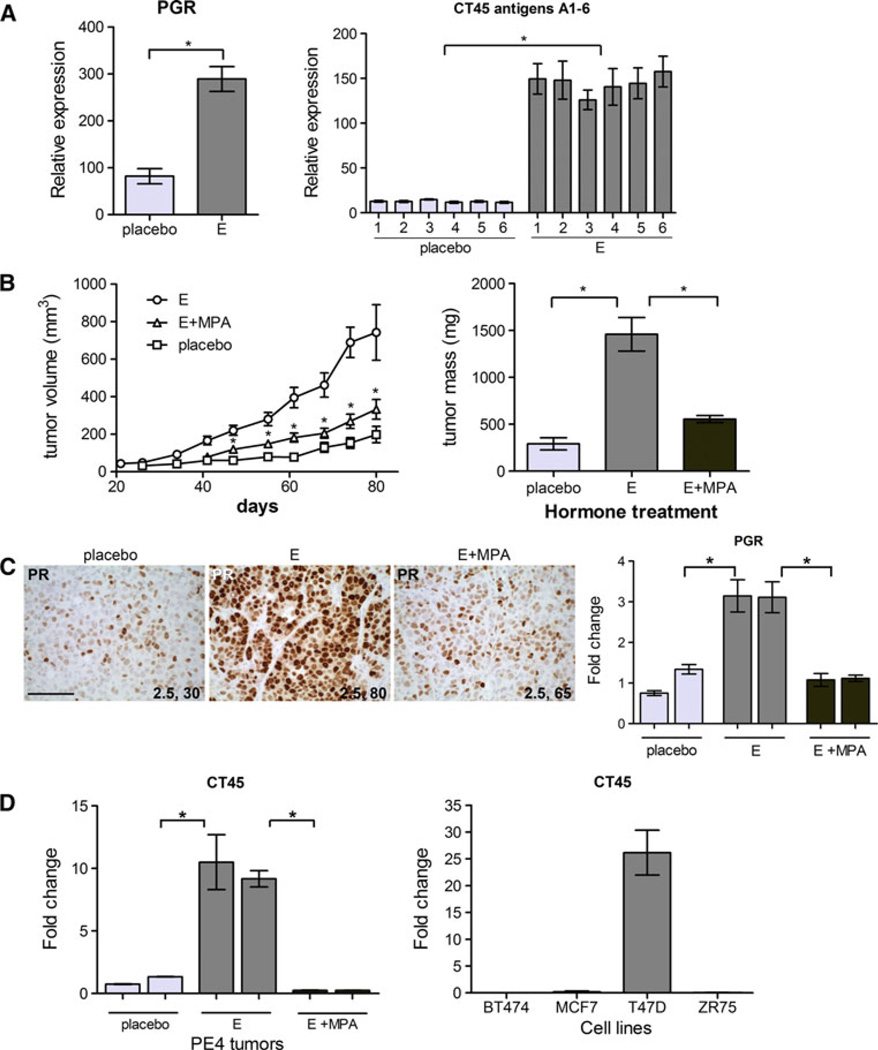
Bypassing estrogen receptor (ER) signaling during development of endocrine resistance remains the most common cause of disease progression and mortality in breast cancer patients. To date, the majority of molecular research on ER action in breast cancer has occurred in cell line models derived from late stage disease. Here we describe patient-derived ER+ luminal breast tumor models for the study of intratumoral hormone and receptor action. Human breast tumor samples obtained from patients post surgery were immediately transplanted into NOD/SCID or NOD/SCID/ILIIrg(-/-) mice under estrogen supplementation. Five transplantable patient-derived ER+ breast cancer xenografts were established, derived from both primary and metastatic cases. These were assessed for estrogen dependency, steroid receptor expression, cancer stem cell content, and endocrine therapy response. Gene expression patterns were determined in select tumors ±estrogen and ±endocrine therapy. Xenografts morphologically resembled the patient tumors of origin, and expressed similar levels of ER (5-99 %), and progesterone and androgen receptors, over multiple passages. Four of the tumor xenografts were estrogen dependent, and tamoxifen or estrogen withdrawal (EWD) treatment abrogated estrogen-dependent growth and/or tumor morphology. Analysis of the ER transcriptome in select tumors revealed notable differences in ER mechanism of action, and downstream activated signaling networks, in addition to identifying a small set of common estrogen-regulated genes. Treatment of a naïve tumor with tamoxifen or EWD showed similar phenotypic responses, but relatively few similarities in estrogen-dependent transcription, and affected signaling pathways. Several core estrogen centric genes were shared with traditional cell line models. However, novel tumor-specific estrogen-regulated potential target genes, such as cancer/testis antigen 45, were uncovered. These results evoke the importance of mapping both conserved and tumor-unique ER programs in breast cancers. Furthermore, they underscore the importance of primary xenografts for improved understanding of ER+ breast cancer heterogeneity and development of personalized therapies.
Conflict of interest statement
Figures
Similar articles
-
MEL-18 loss mediates estrogen receptor-α downregulation and hormone independence.J Clin Invest. 2015 May;125(5):1801-14. doi: 10.1172/JCI73743. Epub 2015 Mar 30. J Clin Invest. 2015. PMID: 25822021 Free PMC article.
-
Role of RBP2-Induced ER and IGF1R-ErbB Signaling in Tamoxifen Resistance in Breast Cancer.J Natl Cancer Inst. 2018 Apr 1;110(4). doi: 10.1093/jnci/djx207. J Natl Cancer Inst. 2018. PMID: 29028222
-
Progesterone metabolites regulate induction, growth, and suppression of estrogen- and progesterone receptor-negative human breast cell tumors.Breast Cancer Res. 2013 May 11;15(3):R38. doi: 10.1186/bcr3422. Breast Cancer Res. 2013. PMID: 25927181 Free PMC article.
-
Mechanisms of tamoxifen resistance in the treatment of advanced breast cancer.Acta Oncol. 1996;35 Suppl 5:9-14. doi: 10.3109/02841869609083961. Acta Oncol. 1996. PMID: 9142958 Review.
-
Growth factor signalling and response to endocrine therapy: the Royal Marsden Experience.Endocr Relat Cancer. 2005 Jul;12 Suppl 1:S113-7. doi: 10.1677/erc.1.01044. Endocr Relat Cancer. 2005. PMID: 16113087 Review.
Cited by
-
Progesterone-inducible cytokeratin 5-positive cells in luminal breast cancer exhibit progenitor properties.Horm Cancer. 2013 Feb;4(1):36-49. doi: 10.1007/s12672-012-0127-5. Epub 2012 Nov 27. Horm Cancer. 2013. PMID: 23184698 Free PMC article.
-
NEMO, a Transcriptional Target of Estrogen and Progesterone, Is Linked to Tumor Suppressor PML in Breast Cancer.Cancer Res. 2017 Jul 15;77(14):3802-3813. doi: 10.1158/0008-5472.CAN-16-2794. Epub 2017 May 17. Cancer Res. 2017. PMID: 28515148 Free PMC article.
-
Efficacy and Molecular Mechanisms of Differentiated Response to the Aurora and Angiogenic Kinase Inhibitor ENMD-2076 in Preclinical Models of p53-Mutated Triple-Negative Breast Cancer.Front Oncol. 2017 May 15;7:94. doi: 10.3389/fonc.2017.00094. eCollection 2017. Front Oncol. 2017. PMID: 28555173 Free PMC article.
-
Pilot studies for personalized cancer medicine: focusing on the patient for treatment selection.Oncologist. 2013;18(11):1180-8. doi: 10.1634/theoncologist.2013-0135. Epub 2013 Oct 17. Oncologist. 2013. PMID: 24136009 Free PMC article.
-
Endocrine-therapy-resistant ESR1 variants revealed by genomic characterization of breast-cancer-derived xenografts.Cell Rep. 2013 Sep 26;4(6):1116-30. doi: 10.1016/j.celrep.2013.08.022. Epub 2013 Sep 19. Cell Rep. 2013. PMID: 24055055 Free PMC article.
References
-
- Bardou VJ, Arpino G, Elledge RM, Osborne CK, Clark GM. Progesterone receptor status significantly improves outcome prediction over estrogen receptor status alone for adjuvant endocrine therapy in two large breast cancer databases. J Clin Oncol. 2003;21(10):1973–1979. - PubMed
-
- Moinfar F, Okcu M, Tsybrovskyy O, Regitnig P, Lax SF, Weybora W, Ratschek M, Tavassoli FA, Denk H. Androgen receptors frequently are expressed in breast carcinomas: potential relevance to new therapeutic strategies. Cancer. 2003;98(4):703–711. - PubMed
-
- Gonzalez LO, Corte MD, Vazquez J, Junquera S, Sanchez R, Alvarez AC, Rodriguez JC, Lamelas ML, Vizoso FJ. Androgen receptor expression in breast cancer: relationship with clinicopathological characteristics of the tumors, prognosis, and expression of metalloproteases and their inhibitors. BMC Cancer. 2008;8:149. - PMC - PubMed
Publication types
MeSH terms
Substances
Grants and funding
LinkOut - more resources
Full Text Sources
Other Literature Sources
Medical
Research Materials
Miscellaneous
