

doi: 10.1007/978-1-4614-3704-8_26.
Mass spectrometry tools for analysis of intermolecular interactions
Affiliations
- PMID: 22821539
- PMCID: PMC4638115
- DOI: 10.1007/978-1-4614-3704-8_26
Item in Clipboard
Mass spectrometry tools for analysis of intermolecular interactions
Methods Mol Biol.
2012.
Abstract
The small quantities of protein required for mass spectrometry (MS) make it a powerful tool to detect binding (protein-protein, protein-small molecule, etc.) of proteins that are difficult to express in large quantities, as is the case for many intrinsically disordered proteins. Chemical cross-linking, proteolysis, and MS analysis, combined, are a powerful tool for the identification of binding domains. Here, we present a traditional approach to determine protein-protein interaction binding sites using heavy water ((18)O) as a label. This technique is relatively inexpensive and can be performed on any mass spectrometer without specialized software.
Figures
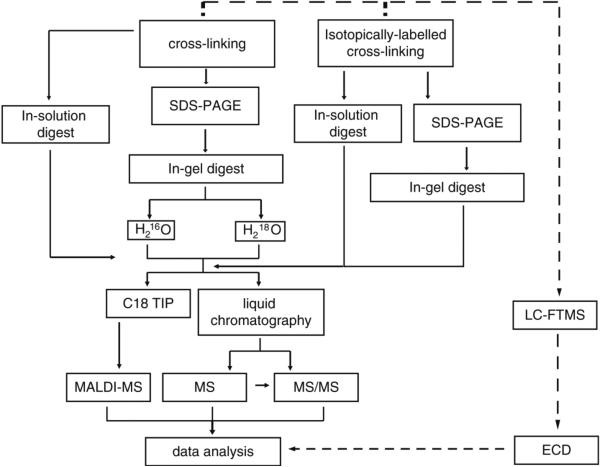
Mass spectrometry analysis of protein binding work-flow.

Heavy water labeled peptides and cross-linked peptides. (a) Mass spectra of a peptide; box zoomed in (b). (b) An unlabelled m/z at 1,380.7 and its labeled counterpart at 1,384.7; the shift in mass of four indicates a non-cross-linked peptide. (c) Mass Spectra of a cross-linked peptide (box; zoomed in (d)). Analyzing the spectra by hand allows for the majority of cross-linked pairs to be identified. (d) An unlabelled m/z at 2,156.1 and its labeled counterpart at 2,164.5; the shift in mass of eight indicates a cross-linked peptide. The cross-linking complicates the spectral analysis; however, it is still possible to distinguish the pair of related m/z values based on the isotopic label.

Noncovalent Interactions using the FTICR. (Top) Spectra of protein alone. (Bottom) Protein incubated with a panel of small molecules. The addition of a new peak indicates protein–compound complex (noncovalent interaction).
Similar articles
-
Chemical cross-linking and mass spectrometric identification of sites of interaction for UreD, UreF, and urease.J Biol Chem. 2004 Apr 9;279(15):15305-13. doi: 10.1074/jbc.M312979200. Epub 2004 Jan 28. J Biol Chem. 2004. PMID: 14749331
-
Probing alpha-crystallin structure using chemical cross-linkers and mass spectrometry.Mol Vis. 2004 Nov 16;10:857-66. Mol Vis. 2004. PMID: 15570221
-
Quantitative evaluation of protein conformation in pharmaceuticals using cross-linking reactions coupled with LC-MS/MS analysis.J Pharm Biomed Anal. 2011 Jun 1;55(3):574-82. doi: 10.1016/j.jpba.2011.01.038. Epub 2011 Mar 1. J Pharm Biomed Anal. 2011. PMID: 21367553
-
Advances in protein complex analysis by chemical cross-linking coupled with mass spectrometry (CXMS) and bioinformatics.Biochim Biophys Acta. 2016 Jan;1864(1):123-9. doi: 10.1016/j.bbapap.2015.05.015. Epub 2015 May 27. Biochim Biophys Acta. 2016. PMID: 26025770 Review.
-
Analysis of proteins and proteomes by mass spectrometry.Annu Rev Biochem. 2001;70:437-73. doi: 10.1146/annurev.biochem.70.1.437. Annu Rev Biochem. 2001. PMID: 11395414 Review.
Cited by
-
Molecular interaction networks and drug development: Novel approach to drug target identification and drug repositioning.FASEB J. 2023 Jan;37(1):e22660. doi: 10.1096/fj.202201683R. FASEB J. 2023. PMID: 36468661 Free PMC article.
References
-
- Dunker AK, et al. Intrinsically disordered protein. (Translated from eng). J Mol Graph Model. 2001;19(1):26–59. (in eng) - PubMed
-
- Yates JR, Ruse CI, Nakorchevsky A. Proteomics by mass spectrometry: approaches, advances, and applications. (Translated from eng). Annu Rev Biomed Eng. 2009;11:49–79. (in eng) - PubMed
-
- Back JW, de Jong L, Muijsers AO, de Koster CG. Chemical cross-linking and mass spectrometry for protein structural modeling. (Translated from eng). J Mol Biol. 2003;331(2):303–313. (in eng) - PubMed
-
- Eyles SJ, Kaltashov IA. Methods to study protein dynamics and folding by mass spectrometry. (Translated from eng). Methods. 2004;34(1):88–99. (in eng) - PubMed
-
- Farmer TB, Caprioli RM. Determination of protein-protein interactions by matrix-assisted laser desorption/ionization mass spectrometry. (Translated from eng). J Mass Spectrom. 1998;33(8):697–704. (in eng) - PubMed
Publication types
MeSH terms
Substances
Grants and funding
LinkOut - more resources
Full Text Sources
