. 2012 Oct;40(18):8965-78.
doi: 10.1093/nar/gks665. Epub 2012 Jul 19.

Proximity of H2A.Z containing nucleosome to the transcription start site influences gene expression levels in the mammalian liver and brain

Affiliations

Proximity of H2A.Z containing nucleosome to the transcription start site influences gene expression levels in the mammalian liver and brain

Rhishikesh Bargaje et al. Nucleic Acids Res. 2012 Oct.

Abstract

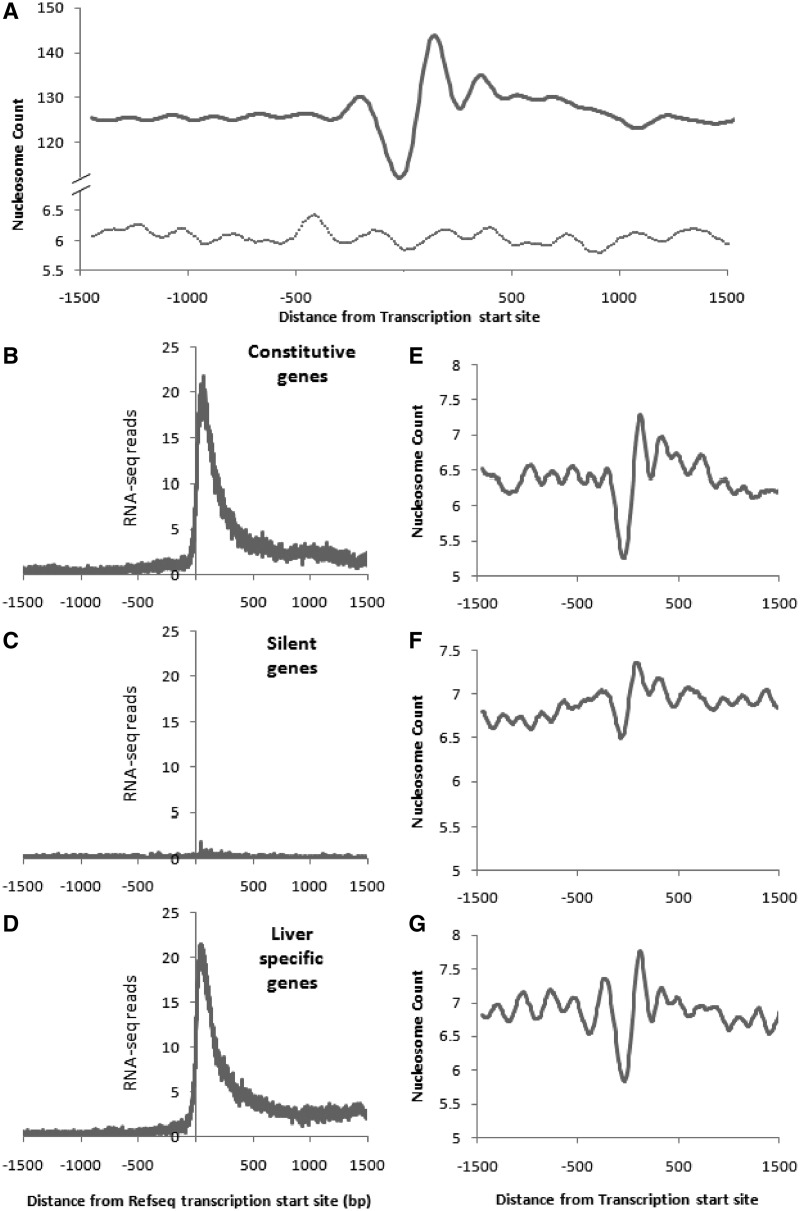
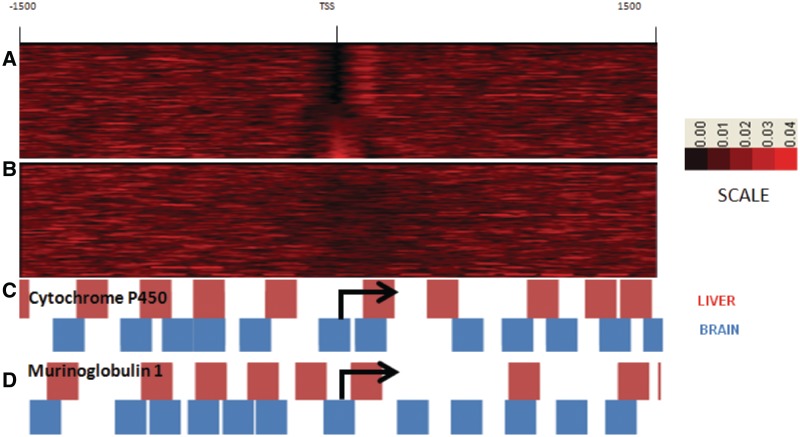
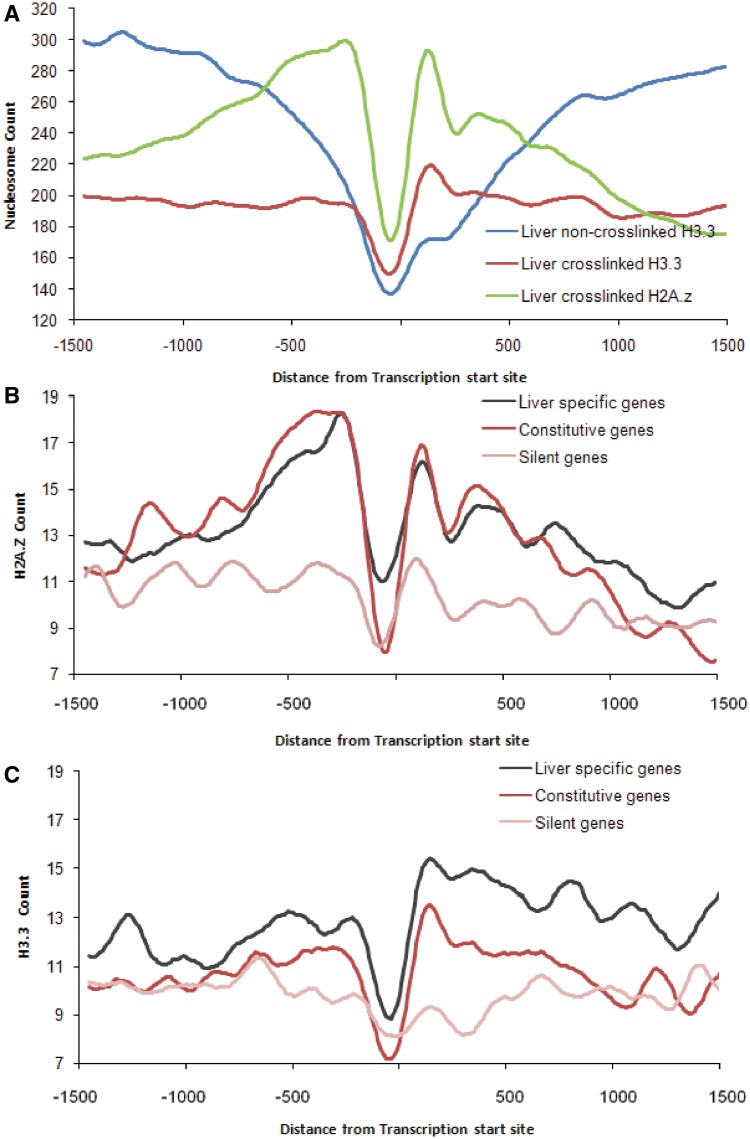
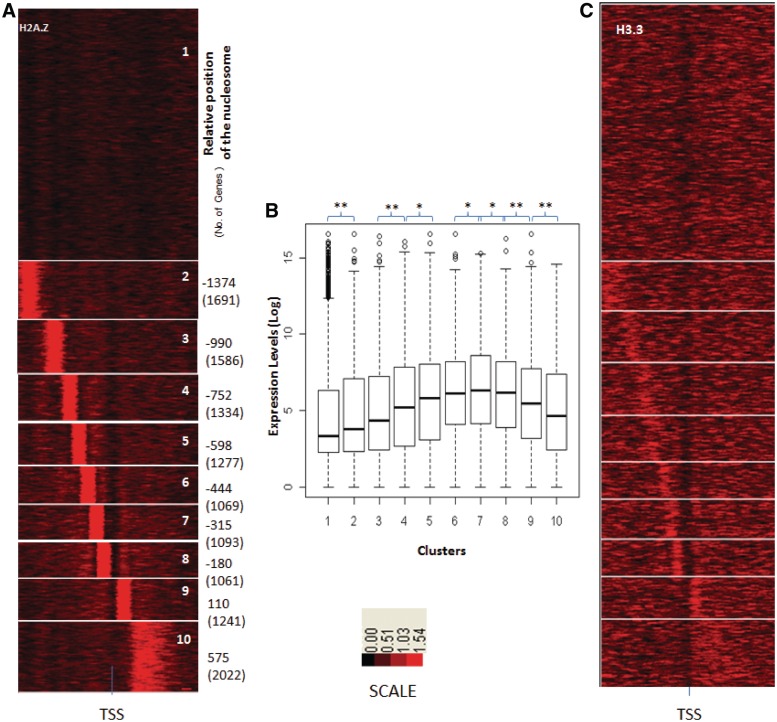
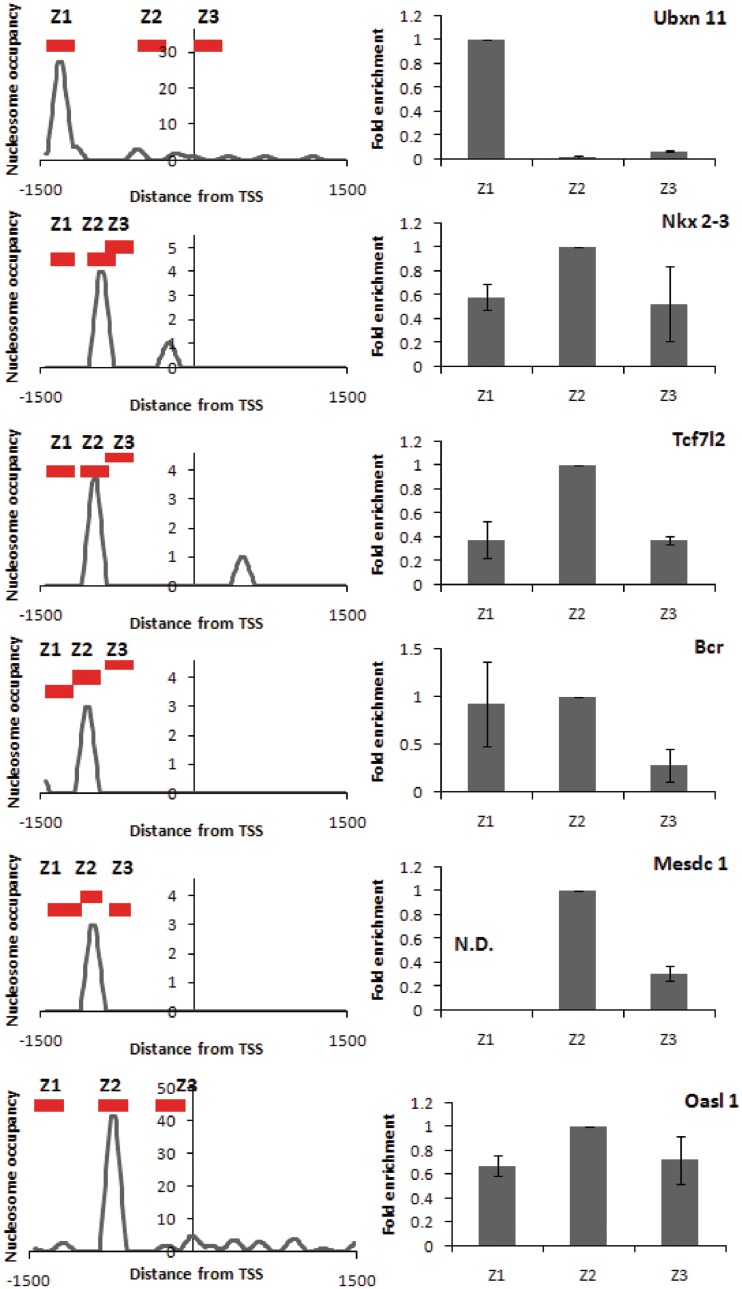
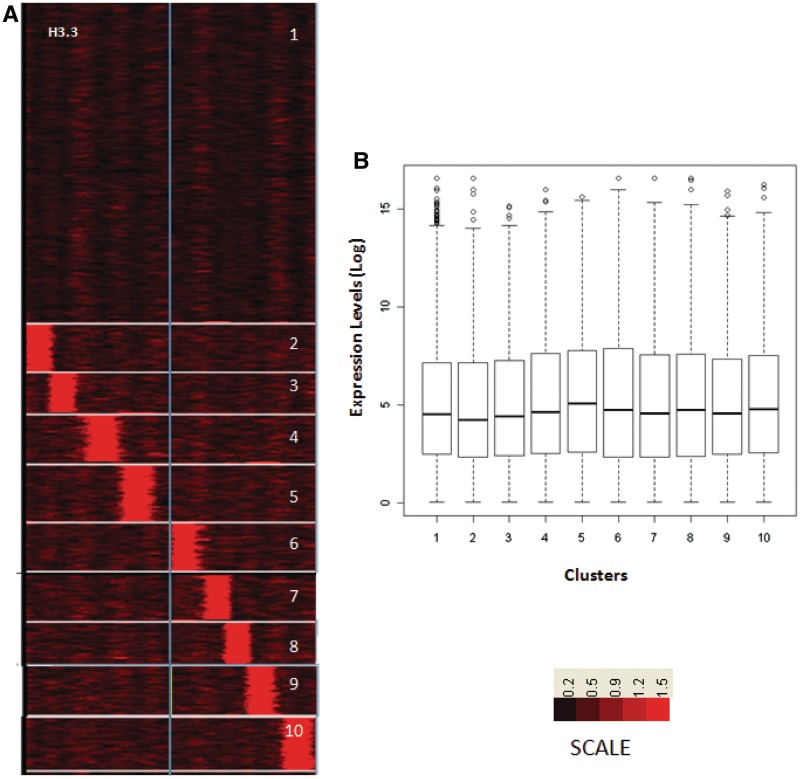
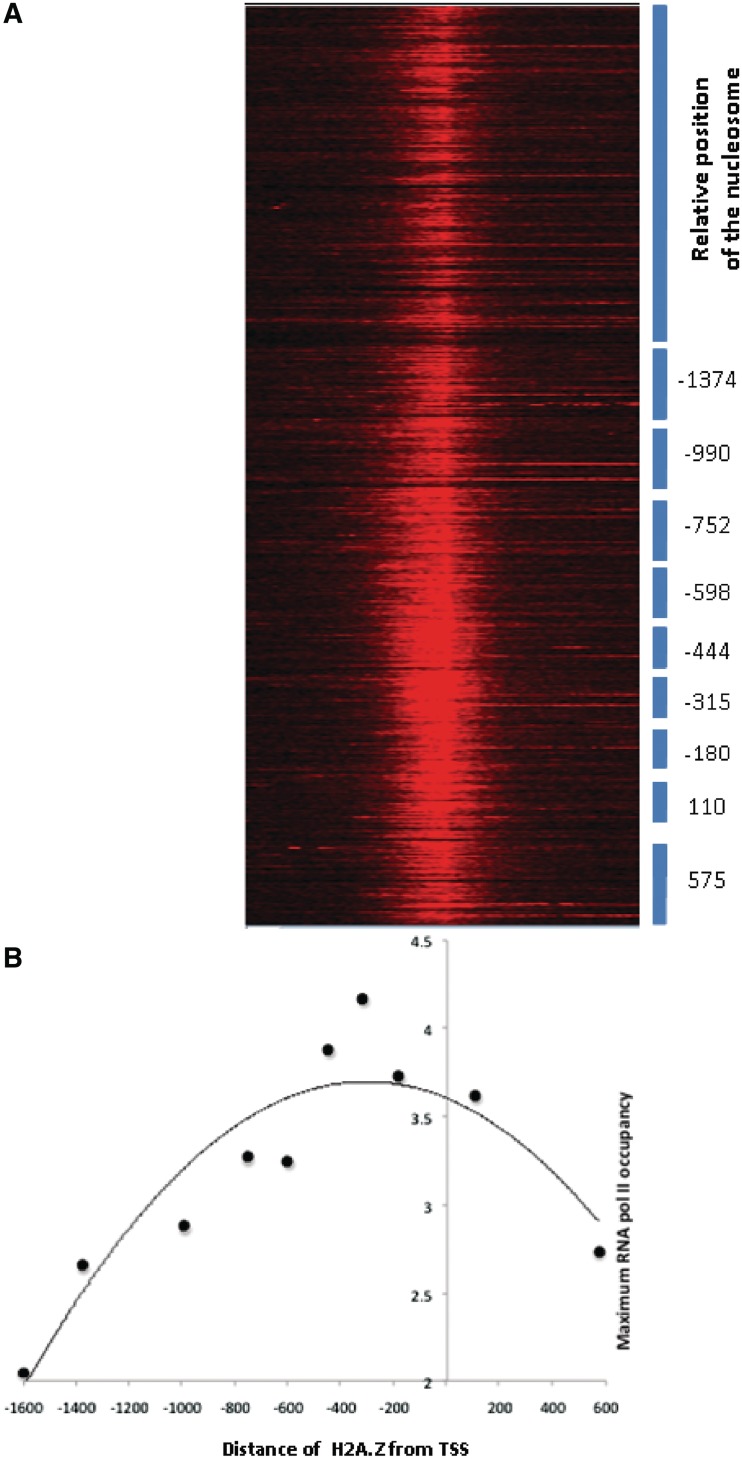
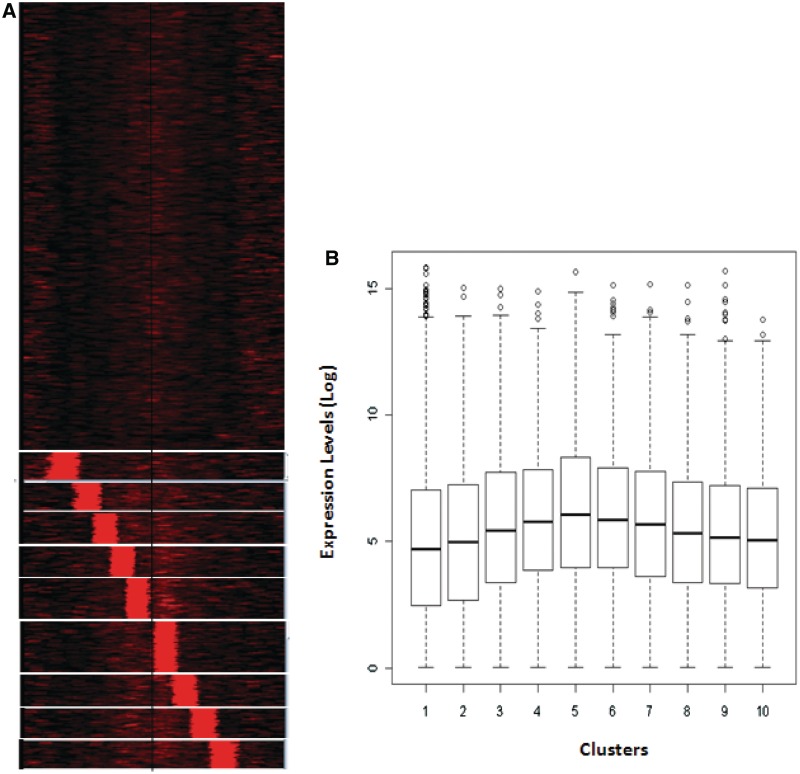
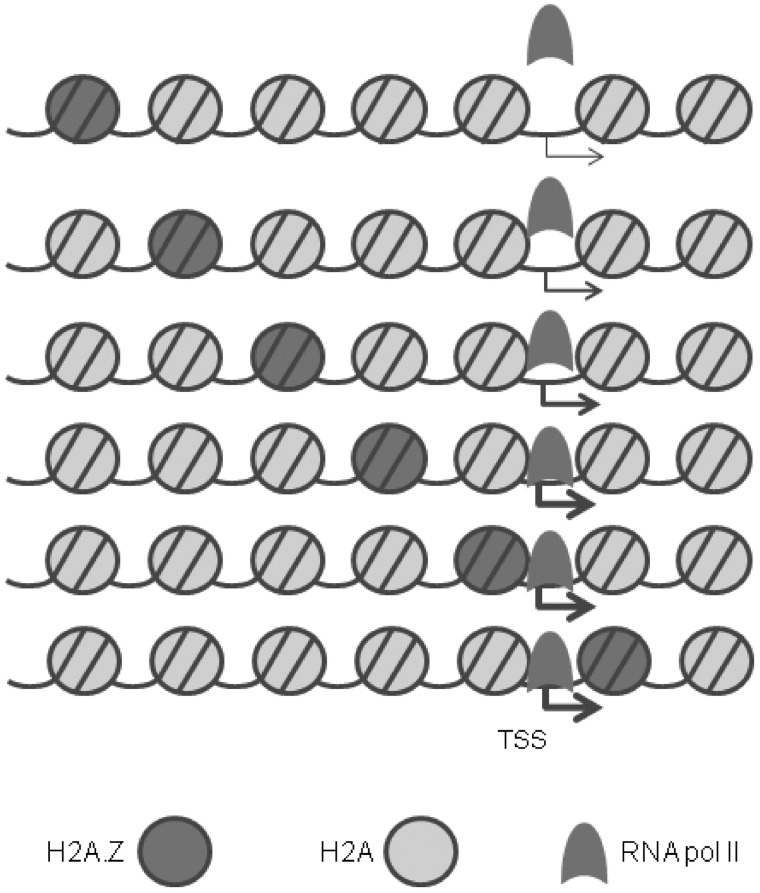
Nucleosome positioning maps of several organisms have shown that Transcription Start Sites (TSSs) are marked by nucleosome depleted regions flanked by strongly positioned nucleosomes. Using genome-wide nucleosome maps and histone variant occupancy in the mouse liver, we show that the majority of genes were associated with a single prominent H2A.Z containing nucleosome in their promoter region. We classified genes into clusters depending on the proximity of H2A.Z to the TSS. The genes with no detectable H2A.Z showed lowest expression level, whereas H2A.Z was positioned closer to the TSS of genes with higher expression levels. We confirmed this relation between the proximity of H2A.Z and expression level in the brain. The proximity of histone variant H2A.Z, but not H3.3 to the TSS, over seven consecutive nucleosomes, was correlated with expression. Further, a nucleosome was positioned over the TSS of silenced genes while it was displaced to expose the TSS in highly expressed genes. Our results suggest that gene expression levels in vivo are determined by accessibility of the TSS and proximity of H2A.Z.


Figures

Figure 1.
Figure 1.
Nucleosome organization patterns at the TSS of all Refseq, constitutive, silent and tissue-specific genes in liver. The nucleosome counts around the TSS of (A) all Refseq genes (n = 19 815) in liver centred around the TSS and random regions represented by the dotted line (n = 1000). The annotated TSS of Refseq genes (A) is marked by zero. Thousand Random regions of similar length from the genome were analysed and the centre was marked as zero. The counts are normalized to per million reads. RNA-seq data confirm the annotated TSS of mouse Refseq genes in liver for constitutive (n = 1074) (B), silent (n = 947) (C) and tissue-specific genes (n = 886) (D). Selection of genes is described in ‘Materials and Methods’ section. The nucleosome counts of the corresponding regions around the TSS of constitutive (E), silent (F) and tissue-specific genes (G).
Figure 2.
Figure 2.
Nucleosome occupancy at the TSS in liver-specific genes. Nucleosome occupancy at TSS of Liver-specific genes (n = 1074) in the liver (A) and brain (B). Two typical liver-specific genes Cytochrome P 450 (C) and Murinoglobulin (D) have nucleosome-free TSS in the liver, while the same positions are occupied by nucleosome in the brain.
Figure 3.
Figure 3.
ChIP-seq signal for H2A.Z and H3.3 around TSS of Refseq genes. (A) The crosslinked ChIP-seq counts around the TSS of all Refseq genes (n = 19 815) were plotted for three separate ChIP-seq experiments, namely; H2A.Z from crosslinked chromatin, H3.3 from crosslinked and non-crosslinked chromatin. The ChIP-seq counts around the TSS for H2A.Z (B) and H3.3 (C) in liver specific (black), constitutive (red) and silent (pink) genes.
Figure 4.
Figure 4.
H2A.Z positioning around TSS and expression pattern in liver. (A) Clustering of genes according to the ChIP-seq counts around the TSS for H2A.Z. Clusters were rearranged according to proximity of H2A.Z containing nucleosome to TSS of Refseq genes. (B) Log-transformed and normalized expression values of genes in each cluster, inferred from GNFatlas data for liver, was represented as box plots for each cluster. Asterisk represents corrected P-value < 0.01 and double asterisk represents corrected P-value <0.001. Same gene order was used for arranging H3.3 occupancy profiles from crosslinked H3.3 (C).
Figure 5.
Figure 5.
qPCR validation of H2A.Z localization to TSS-distal region of selected genes. Five genes selected from cluster 2(1); 3(4) and 4(1). Left panels show Nucleosome occupancy from GeneTrack representation of Chip-seq data (see ‘Materials and Methods’ section for details). The red bars represent regions amplified by qPCR. Right panel shows fold enrichment in probed regions from q-PCR. Fold enrichment is represented relative to the most enriched region. Error bars represent standard deviations from triplicate experiments.
Figure 6.
Figure 6.
H3.3 occupancy is not correlated to gene expression level. (A) Clustering of genes according to the ChIP-seq counts around the TSS for H3.3 occupancy profiles from crosslinked chromatin. (B) Log-transformed and normalized gene expression values in liver, inferred from GNFatlas data, is represented as box plots for each cluster from (A).
Figure 7.
Figure 7.
RNA polymerase II occupancy is correlated to proximity of H2A.Z. RNA polymerase II occupancy was calculated as described in ‘Materials and Methods’ section. RNA polymerase II occupancy of each gene was calculated from −1500 to +1500 flanking the TSS and used for generating the heat map (A). The blue bars represent the clusters of genes with distinct H2A.Z positioning as in Figure 4A. The maximum RNA polymerase II occupancy for each cluster was plotted against the position of centre of the H2A.Z containing nucleosome for each of the clusters (Figure 4) relative to the TSS (B).
Figure 8.
Figure 8.
H2A.Z positioning around TSS and expression pattern in brain. (A) Clustering of genes according to the ChIP-seq counts around the TSS for H2A.Z from crosslinked chromatin. Clusters were rearranged according to proximity of H2A.Z containing nucleosome to TSS of Refseq genes. (B) Log-transformed and normalized gene expression values in brain, inferred from GNFatlas data, is represented as box plots for each cluster from (A).
Figure 9.
Figure 9.
Schematic representation of nucleosome organization and H2A.Z positioning at eukaryotic promoters in vivo. The region upstream to the TSS is occupied by spaced nucleosomes, one of which contains H2A.Z. The farther this nucleosome is from the TSS, the lesser is the expression (thickness of the arrow) and RNA pol II occupancy at the TSS. The accessibility of the TSS is also determined by the displacement of the +1 nucleosome downstream, leaving a wide nucleosome-free region at the TSS.

Similar articles

Cited by

References

    1. Jiang C, Pugh BF. Nucleosome positioning and gene regulation: advances through genomics. Nat. Rev. Genet. 2009;10:161–172. - PMC - PubMed
    1. Lantermann AB, Straub T, Stralfors A, Yuan GC, Ekwall K, Korber P. Schizosaccharomyces pombe genome-wide nucleosome mapping reveals positioning mechanisms distinct from those of Saccharomyces cerevisiae. Nat. Struct. Mol. Biol. 2010;17:251–257. - PubMed
    1. Mavrich TN, Jiang C, Ioshikhes IP, Li X, Venters BJ, Zanton SJ, Tomsho LP, Qi J, Glaser RL, Schuster SC, et al. Nucleosome organization in the Drosophila genome. Nature. 2008;453:358–362. - PMC - PubMed
    1. Schones DE, Cui K, Cuddapah S, Roh TY, Barski A, Wang Z, Wei G, Zhao K. Dynamic regulation of nucleosome positioning in the human genome. Cell. 2008;132:887–898. - PMC - PubMed
    1. Spies N, Nielsen CB, Padgett RA, Burge CB. Biased chromatin signatures around polyadenylation sites and exons. Mol. Cell. 2009;36:245–254. - PMC - PubMed

Publication types