. 2012 Oct;60(10):1605-18.
doi: 10.1002/glia.22381. Epub 2012 Jul 20.

Autotaxin/ENPP2 regulates oligodendrocyte differentiation in vivo in the developing zebrafish hindbrain

Affiliations

Autotaxin/ENPP2 regulates oligodendrocyte differentiation in vivo in the developing zebrafish hindbrain

Larra W Yuelling et al. Glia. 2012 Oct.

Abstract

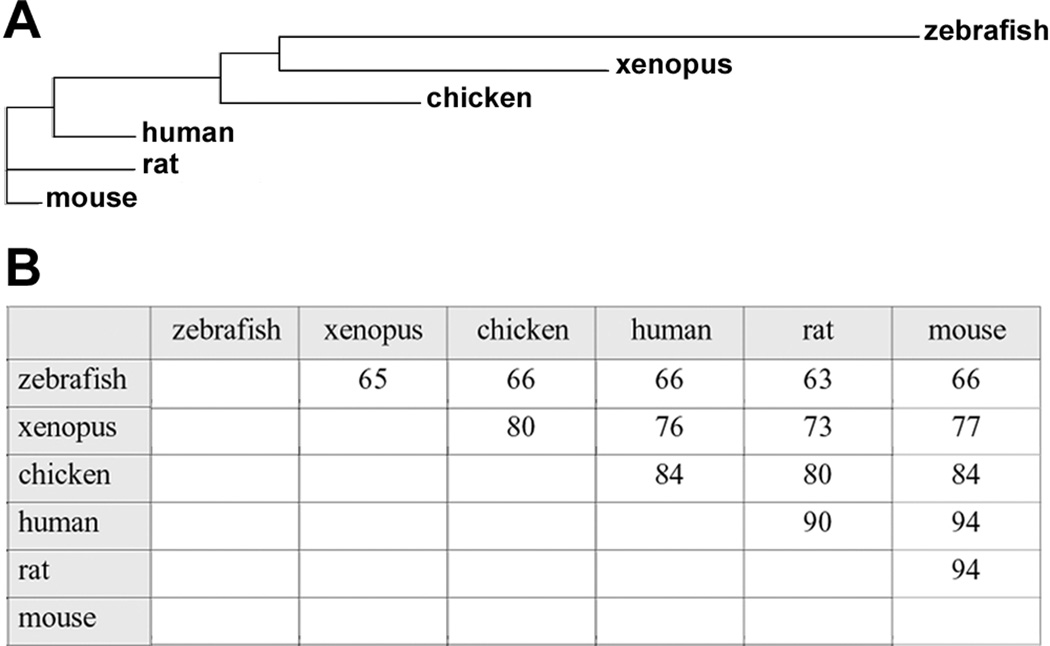
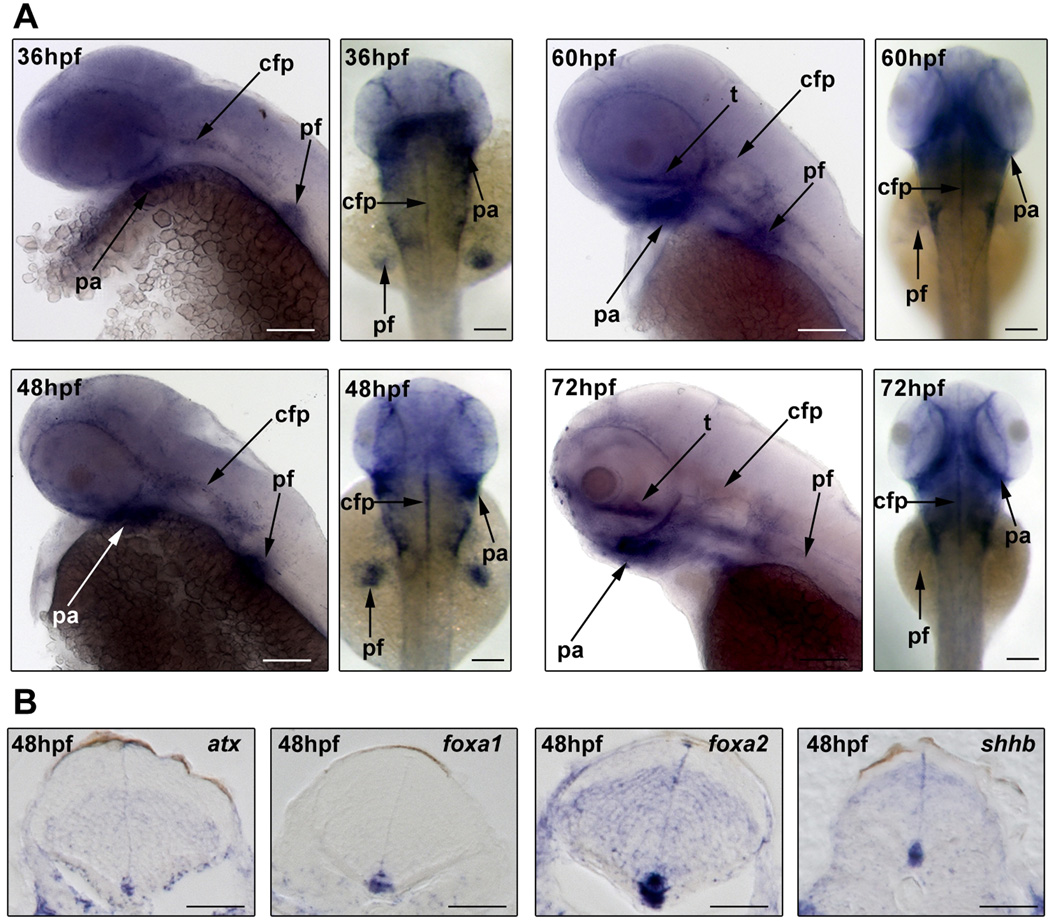
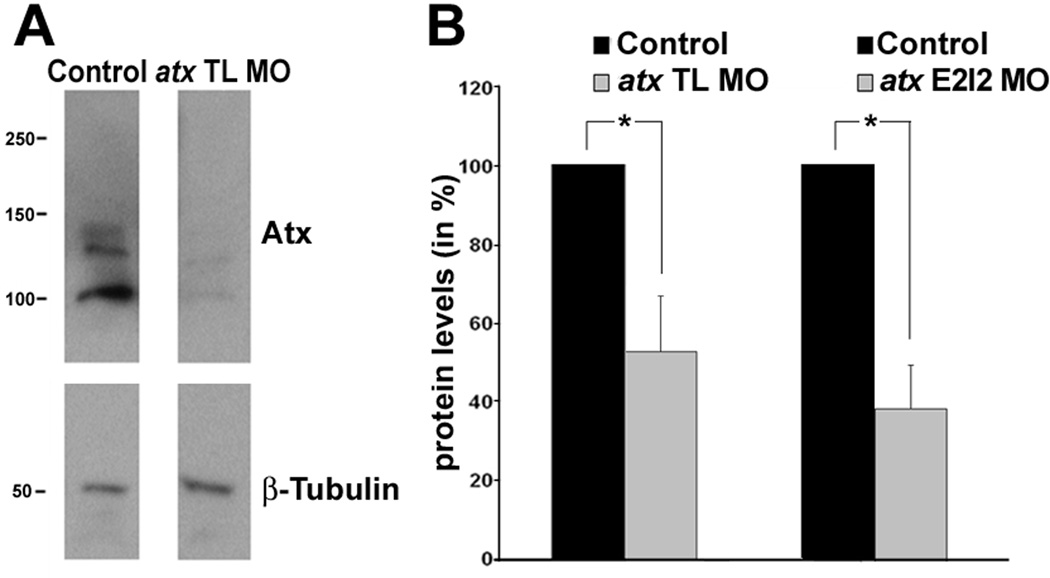
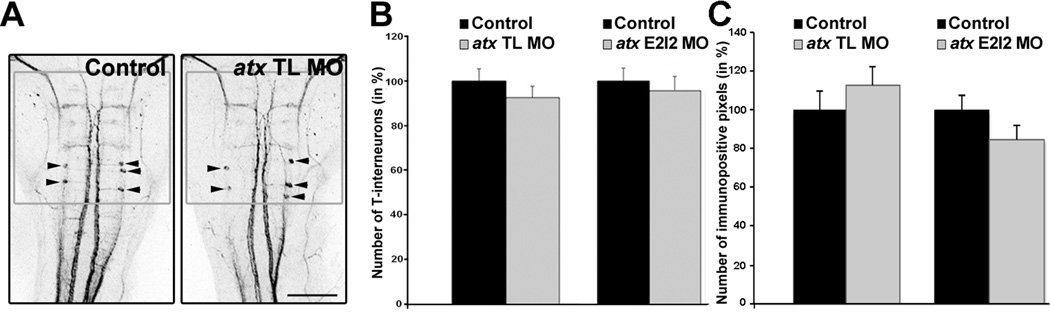
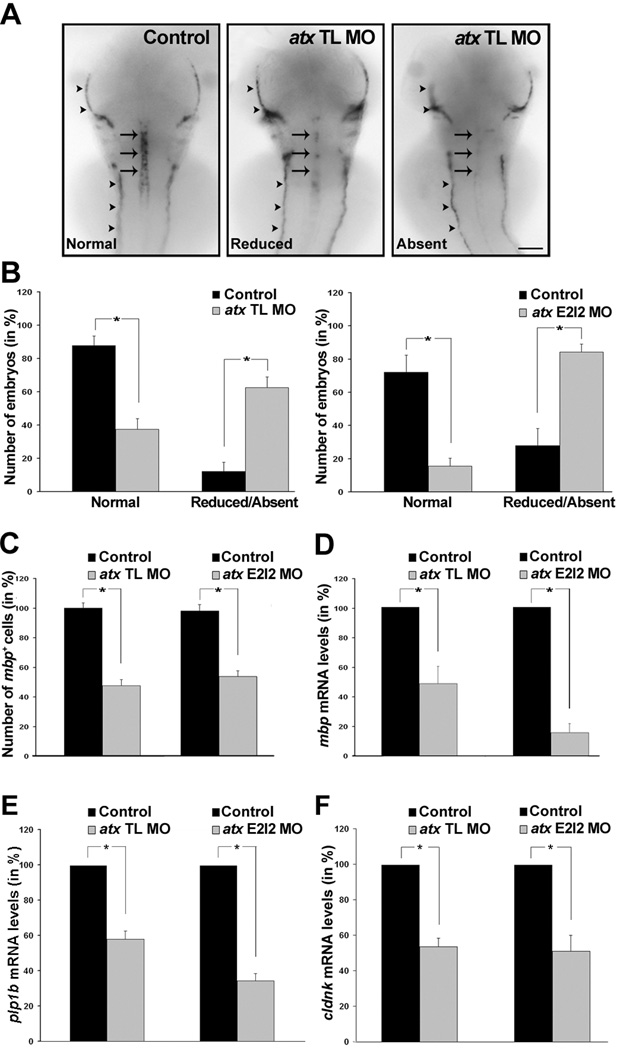
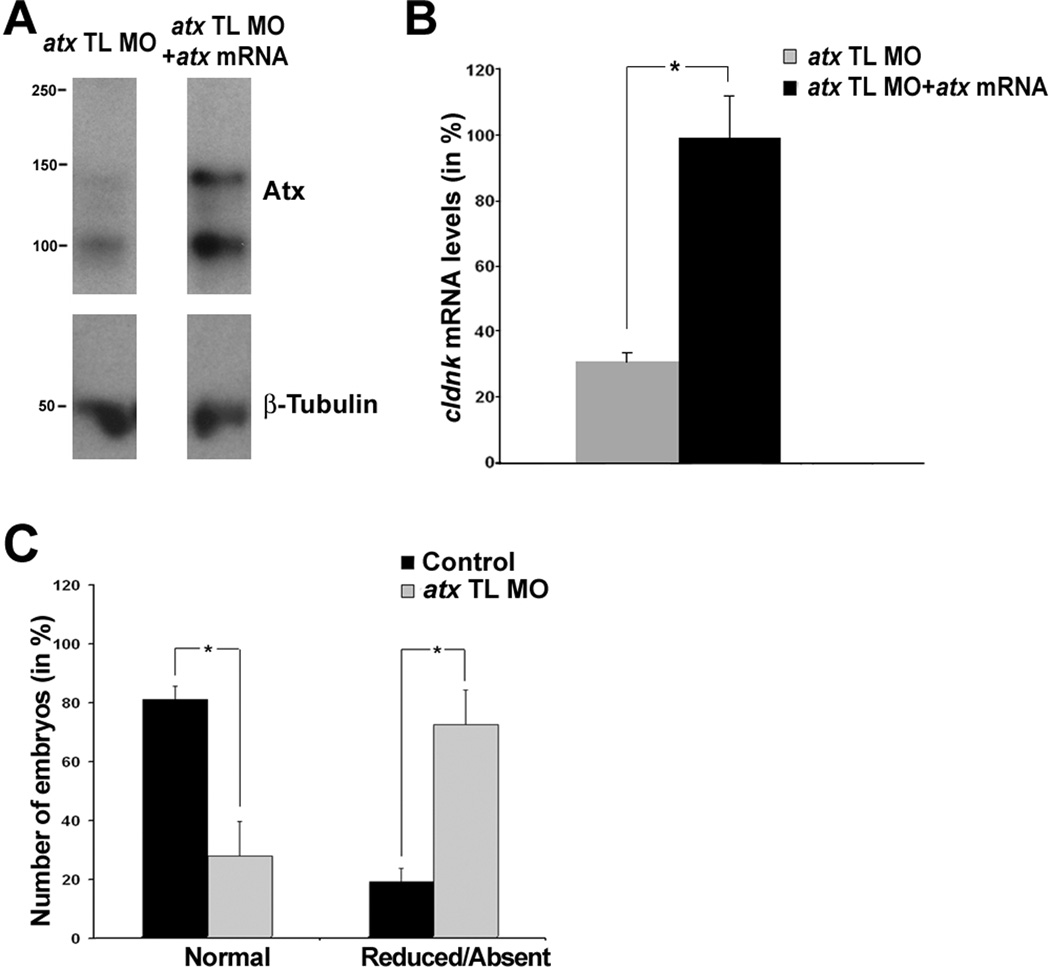
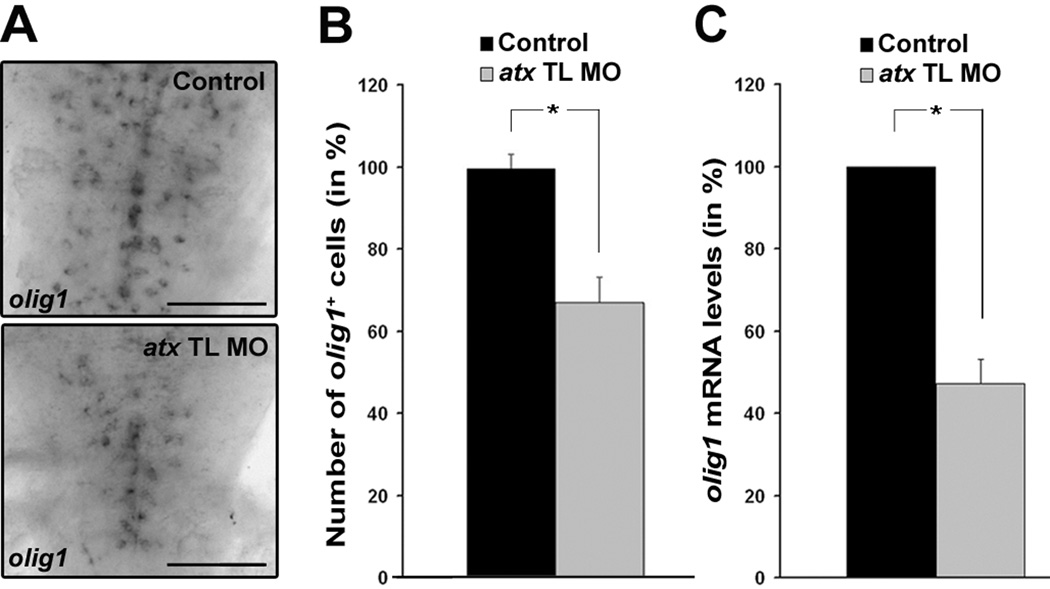
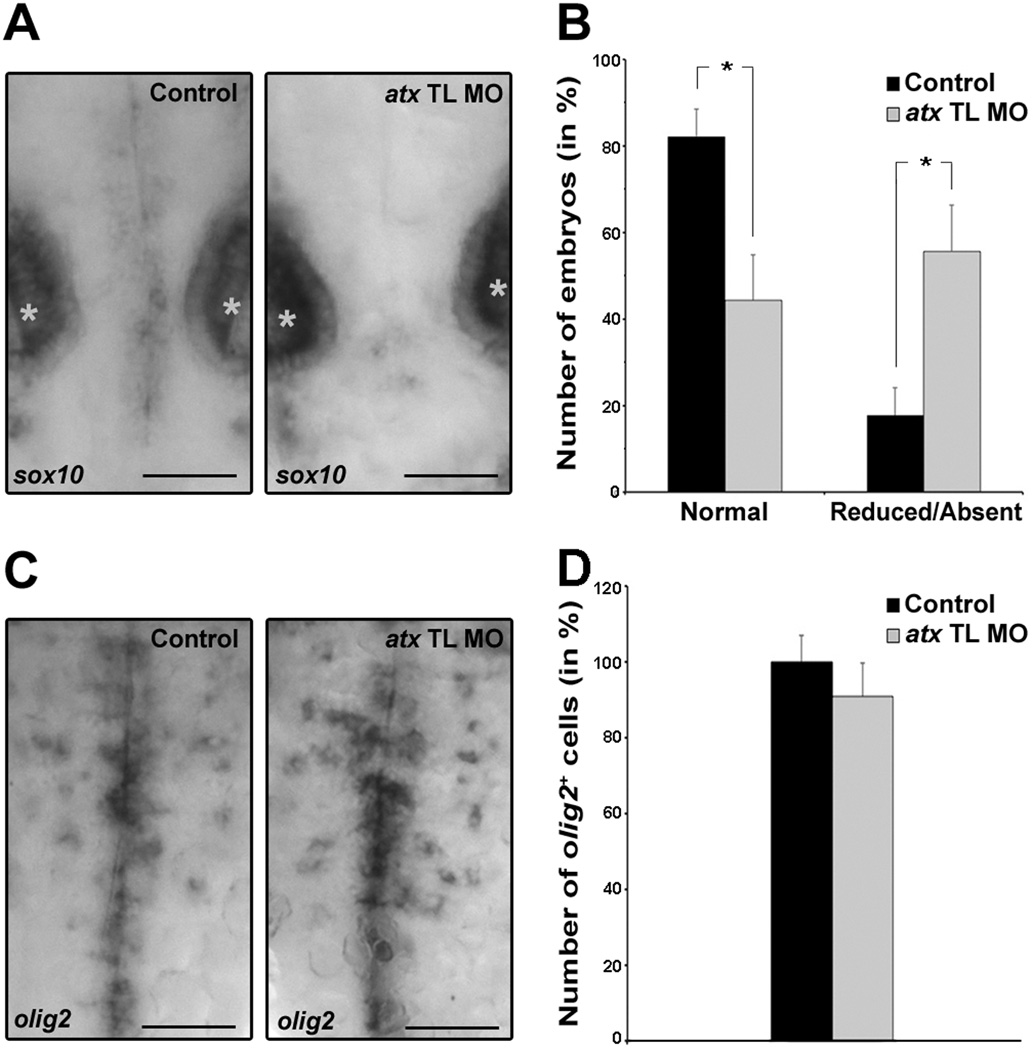
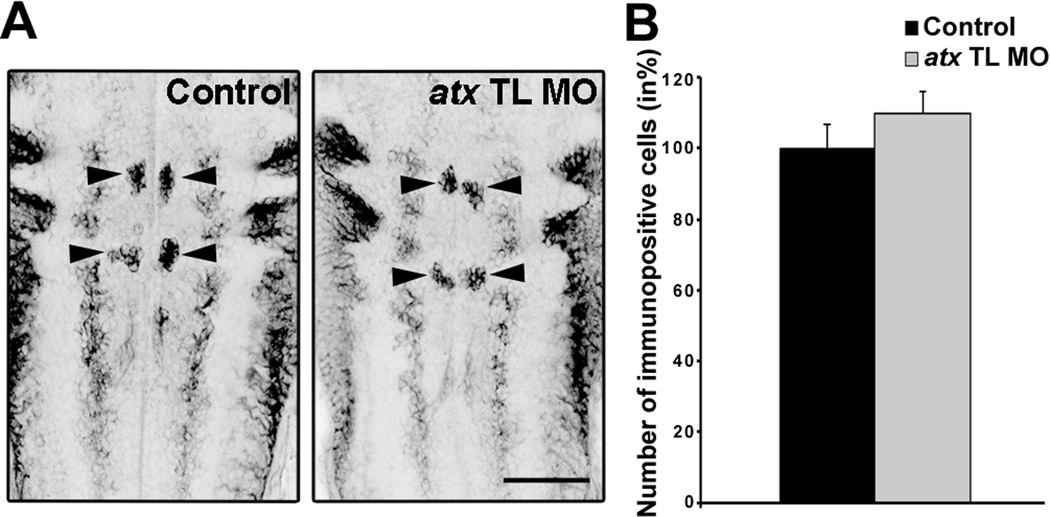
During development, progenitors that are committed to differentiate into oligodendrocytes, the myelinating cells of the central nervous system (CNS), are generated within discrete regions of the neuroepithelium. More specifically, within the developing spinal cord and hindbrain ventrally located progenitor cells that are characterized by the expression of the transcription factor olig2 give temporally rise to first motor neurons and then oligodendrocyte progenitors. The regulation of this temporal neuron-glial switch has been found complex and little is known about the extrinsic factors regulating it. Our studies described here identified a zebrafish ortholog to mammalian atx, which displays evolutionarily conserved expression pattern characteristics. Most interestingly, atx was found to be expressed by cells of the cephalic floor plate during a time period when ventrally-derived oligodendrocyte progenitors arise in the developing hindbrain of the zebrafish. Knock-down of atx expression resulted in a delay and/or inhibition of the timely appearance of oligodendrocyte progenitors and subsequent developmental stages of the oligodendrocyte lineage. This effect of atx knock-down was not accompanied by changes in the number of olig2-positive progenitor cells, the overall morphology of the axonal network or the number of somatic abducens motor neurons. Thus, our studies identified Atx as an extrinsic factor that is likely secreted by cells from the floor plate and that is involved in regulating specifically the progression of olig2-positive progenitor cells into lineage committed oligodendrocyte progenitors.


Figures

Fig. 1
Fig. 1
A conserved ortholog to mammalian atx exists in the zebrafish. A: Guide tree depicting evolutionary sequence relationships between known vertebrate Atx proteins. B: Identity table depicting amino acid sequence identities between known vertebrate Atx proteins. For Ensembl transcript IDs see Fig. S1.
Fig. 2
Fig. 2
During zebrafish development atx is expressed in a pattern that includes a prominent expression in the ventral CNS. Embryos were collected at different developmental ages and analyzed by whole-mount in situ hybridization. A: Representative images of whole-mount embryos in situ hybridized for atx. Developmental ages are noted in hours post fertilization (hpf). Left panels for each developmental age depict lateral views, anterior is to the left. Right panels depict dorsal views, anterior is to the top. pharyngeal arches (pa), pectoral fin buds (pf), cephalic floor plate (cfp) and trabeculae cranii (t). Scale bars: 100 µm. B: Representative images of transverse sections through the hindbrain of 48 hpf embryos. Dorsal is to the top. cephalic floor plate markers (foxa1, foxa2, shhb). Scale bars: 50 µm
Fig. 3
Fig. 3
Injection of anti-atx morpholino oligonucleotides leads to a significant reduction in Atx protein levels. Embryos were injected with either an anti-atx translation blocking (atx TL MO) or an anti-atx splice site targeted (atx E2I2 MO) morpholino oligonucleotide and analyzed at 48 hpf. As controls, 5 base pair mismatch morpholino oligonucleotides were used. A: Representative Western blot depicting Atx protein levels. β-tubulin was used for normalization. Numbers on the left indicate molecular weights in kD. Protein forms with apparent molecular weights of 100 kD and 125/135 kD were detected and are most likely a result of differences in posttranslational modifications (Jansen et al., 2007; Pradere et al., 2007). B: Bar graphs depicting Atx protein levels as % of control (control = 100%). The graphs depict three independent experiments. Means and standard errors are shown. Stars indicate an overall significance level of p<0.05 (one-sample t-test).
Fig. 4
Fig. 4
In the developing hindbrain knock-down of atx expression does not affect neuronal/axonal organization. Embryos were treated as described in Fig. 3 and analyzed at 48 hpf. A: Representative images of embryos after whole-mount immnuostaining with the RMO44 antibody. Images represent 2D maximum projections of stacks of 5.66 µm optical sections. Arrowheads point toward T-interneurons. The gray boxes indicate the area used to determine the number of RMO44-immuno-positive pixels. Scale bar: 100 µm. B–C: Bar graphs depicting the number of RMO44-immuno-positive T-interneurons (B) and pixels (C) in % (control = 100%). Means and standard errors of three independent experiments are shown. Student’s t-test revealed no statistically significant differences.
Fig. 5
Fig. 5
In the developing hindbrain knock-down of atx expression leads to a reduction in the number of differentiating oligodendrocytes and in the mRNA levels of oligodendrocyte-enriched genes. Embryos were treated as described in Fig. 3 and analyzed at 66 hpf. A: Representative images of embryos after whole-mount in situ hybridization with a probe specific for myelin basic protein (mbp). Expression of mbp in oligodendrocytes (arrows) was classified into three categories (normal, reduced and absent). Expression of mbp in the anterior and posterior lateral line is marked by arrowheads. Dorsal views are shown, anterior is to the top. Scale bar: 100 µm. B: Bar graphs depicting the number of embryos with normal or reduced/absent mbp mRNA expression in % (total number of embryos per condition = 100%). Means and standard errors of five (left graph) and four (right graph) independent experiments are shown. Stars indicate an overall two-tailed significance level of p<0.05 (Student’s t-test). C: Bar graphs depicting the number of mbp-positive oligodendrocytes in % (control = 100%). Means and standard errors of four independent experiments are shown. Stars indicate an overall two-tailed significance level of p<0.05 (Student’s t-test). D–F: Bar graphs depicting mRNA levels in % (control = 100%) as determined by quantitative RT-PCR for mbp (D), proteolipid protein (plp1b) (E) and claudin K (cldnk) (F). Means and standard errors of three independent experiments are shown. Stars indicate an overall significance level of p<0.05 (one sample t-test).
Fig. 6
Fig. 6
Co-injection of a synthetic atx mRNA leads to a rescue of the atx knock-down phenotype, and there is no apparent recovery from the atx knock-down-induced phenotype up to 72 hpf. A–B: Embryos were co-injected with atx TL MO and a synthetic atx mRNA and then analyzed at 48 hpf. As control, a 5 base pair mismatch morpholino oligonucleotide was used. A: Representative Western blot depicting Atx protein levels. β-tubulin was used for normalization. Numbers on the left indicate molecular weights in kD. B: Bar graph depicting cldnk mRNA levels in % (control = 100%) as determined by quantitative RT-PCR. Means and standard errors of four independent experiments are shown. The star indicates an overall two-tailed significance level of p<0.05 (Student’s t-test). No statistically significant difference in cldnk mRNA level was found between embryos injected with control MO versus atx TL MO plus atx mRNA (not shown). C: Embryos were treated as described in Fig. 3 and analyzed at 72 hpf. The bar graph depicts the number of embryos with normal or reduced/absent mbp mRNA expression in % (total number of embryos per condition = 100%). Means and standard errors of four independent experiments are shown. Stars indicate an overall two-tailed significance level of p<0.05 (Student’s t-test).
Fig. 7
Fig. 7
In the developing hindbrain knock-down of atx expression leads to a reduction in the number of olig1-positive cells and the levels of olig1 mRNA. Embryos were treated as described in Fig. 3 and analyzed at 66 hpf. A: Representative images of embryos after whole-mount in situ hybridization with a probe specific for olig1. Scale bar: 100 µm. B: Bar graph depicting the number of olig1-positive oligodendrocytes in % (control = 100%). Means and standard errors of three independent experiments are shown. Stars indicate an overall two-tailed significance level of p<0.05 (Student’s t-test). C: Bar graph depicting olig1 mRNA levels in % (control = 100%) as determined by quantitative RT-PCR. Means and standard errors of three independent experiments are shown. Stars indicate an overall significance level of p<0.05 (one sample t-test).
Fig. 8
Fig. 8
In the developing hindbrain knock-down of atx expression leads to a reduction in the number of sox10-positive but not olig2-positive cells. Embryos were treated as described in Fig. 3 and analyzed at 48 hpf. A: Representative images of embryos after whole-mount in situ hybridization with a probe specific for sox10. Stars indicate otic vesicles. Scale bar: 50 µm. B: Bar graph depicting the number of embryos with normal (>2 sox10-positive cells) or reduced/absent (≤2 sox10-positive cells) sox10 expression in % (total number of embryos per condition = 100%). Means and standard errors of six independent experiments are shown. Stars indicate an overall two-tailed significance level of p<0.05 (Student’s t-test). C: Representative images of embryos after whole-mount in situ hybridization with a probe specific for olig2. Scale bar: 50 µm. D: Bar graph depicting the number of olig2-positive oligodendrocytes in % (control = 100%). Means and standard errors of three independent experiments are shown. Student’s t-test revealed no statistically significant difference.
Fig. 9
Fig. 9
In the developing hindbrain knock-down of atx expression does not affect the number of somatic abducens motor neurons. Embryos were treated as described in Fig. 3 and analyzed at 48 hpf. A: Representative images of embryos after whole-mount immunostaining with the Zn-8 antibody. Images represent 2D maximum projections of stacks of 0.87 µm optical sections. Arrows point toward somatic abducens motor neurons. Zn-8-immuno-positive hindbrain commissural axons are only partially captured. Scale bar: 50 µm. B: Bar graph depicting the number of Zn-8-immuno-positive somatic abducens motor neurons in % (control = 100%). Means and standard errors of three independent experiments are shown. Student’s t-test revealed no statistically significant difference.

Similar articles

Cited by

References

    1. Abramoff M, Magelhaes P, Ram S. Image Processing with image. Journal of Biophotonics Int. 2004;11:36–42.
    1. Bachner D, Ahrens M, Betat N, Schroder D, Gross G. Developmental expression analysis of murine autotaxin (ATX) Mech Dev. 1999;84:121–125. - PubMed
    1. Bilican B, Fiore-Heriche C, Compston A, Allen ND, Chandran S. Induction of Olig2 precursors by FGF involves BMP signalling blockade at the Smad level. PLoS One. 2008;3:e2863. - PMC - PubMed
    1. Bradford Y, Conlin T, Dunn N, Fashena D, Frazer K, Howe DG, Knight J, Mani P, Martin R, Moxon SA, et al. ZFIN: enhancements and updates to the Zebrafish Model Organism Database. Nucleic Acids Res. 2011;39(Database issue):D822–D829. - PMC - PubMed
    1. Brosamle C, Halpern ME. Characterization of myelination in the developing zebrafish. Glia. 2002;39:47–57. - PubMed

Publication types

MeSH terms

Substances