

Diffusion tensor imaging correlates with the clinical assessment of disease severity in cervical spondylotic myelopathy and predicts outcome following surgery
- PMID: 22821918
- PMCID: PMC7965104
- DOI: 10.3174/ajnr.A3199
Diffusion tensor imaging correlates with the clinical assessment of disease severity in cervical spondylotic myelopathy and predicts outcome following surgery
Abstract
Background and purpose: CSM is a common neurologic disease that results in progressive disability and eventual paralysis without appropriate treatment. Imaging plays a significant role in the evaluation of CSM and has evolved with recent technical advances. We sought to systematically explore the relationship between clinical disease severity and DTI in CSM, and to investigate the potential use of DTI in surgical decision-making models.
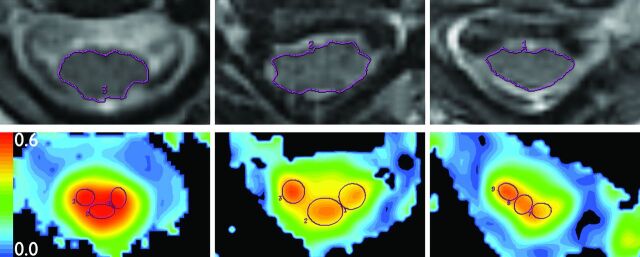
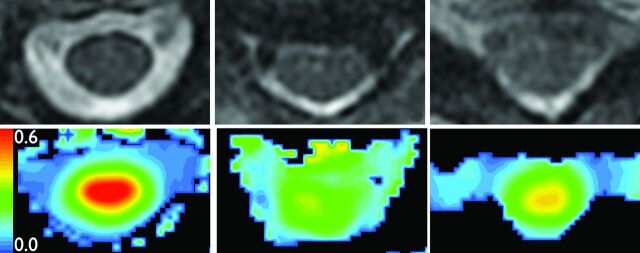
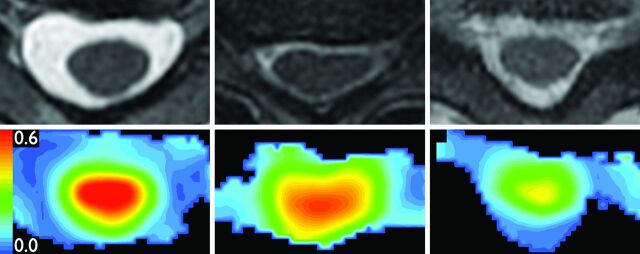
Materials and methods: MR imaging studies and clinical assessments were prospectively collected on 30 patients with CSM. Spearman correlations were used to investigate associations between clinical disease severity and FA at the time of diagnosis. Clinical assessment was performed using mJOA, Nurick, Short Form-36, and NDI scores. Fifteen patients with CSM subsequently underwent decompressive surgery; Spearman correlation and logistic regression were applied to this cohort to study the relationship between baseline DTI measurements and postoperative outcome. Conventional imaging (spinal cord T2 signal intensity and degree of stenosis) was evaluated for comparison with DTI.
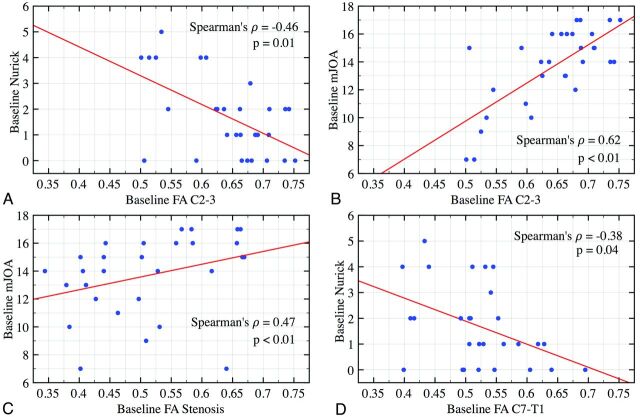
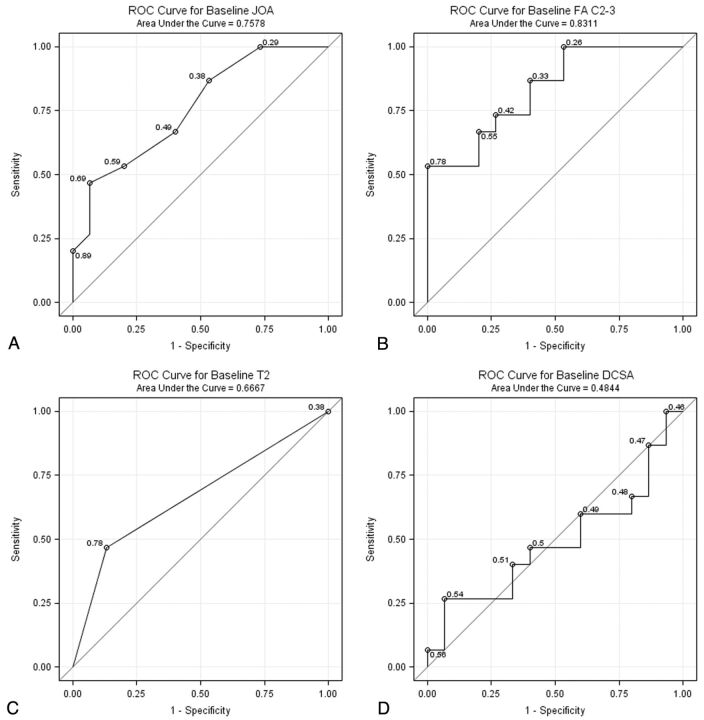
Results: At diagnosis, FA demonstrated a strong correlation with baseline mJOA (r = 0.62, P < .01) and Nurick (r = -0.46, P = .01) scores. After surgery, recovery of function demonstrated by improvement in NDI score was associated with higher FA values on preoperative DTI (r = -0.61, P = .04). Severely affected patients with CSM with disproportionately high FA tended to achieve greater mJOA scores after surgery compared with subjects with lower FA (P = .08). T2 signal intensity was associated with functional status at baseline but did not predict postoperative outcome; degree of stenosis lacked any significant correlation with clinical parameters.
Conclusions: DTI may be a useful diagnostic tool for assessing disease severity in CSM. The predictive value of DTI regarding postoperative outcome may improve surgical decision-making and facilitate health care outcomes research.
Figures
References
-
- Bernhardt M, Hynes RA, Blume HW, et al. Cervical spondylotic myelopathy. J Bone Joint Surg Am 1993;75:119–28 - PubMed
-
- Boden SD, McCowin PR, Davis DO, et al. Abnormal magnetic-resonance scans of the cervical spine in asymptomatic subjects. A prospective investigation. J Bone Joint Surg Am 1990;72:1178–84 - PubMed
-
- Budzik J, Balbi V, Le Thuc V, et al. Diffusion tensor imaging and fibre tracking in cervical spondylotic myelopathy. Eur Radiol 2010;21:426–33 - PubMed
-
- Kara B, Celik A, Karadereler S, et al. The role of DTI in early detection of cervical spondylotic myelopathy: a preliminary study with 3-T MRI. Neuroradiology 2011;53:609–16 - PubMed
Publication types
MeSH terms
LinkOut - more resources
Full Text Sources
Other Literature Sources