. 2012 Sep 1;189(5):2118-30.
doi: 10.4049/jimmunol.1200122. Epub 2012 Jul 20.

CD8+CD45RA+CCR7+FOXP3+ T cells with immunosuppressive properties: a novel subset of inducible human regulatory T cells

Affiliations

CD8+CD45RA+CCR7+FOXP3+ T cells with immunosuppressive properties: a novel subset of inducible human regulatory T cells

Masakatsu Suzuki et al. J Immunol. .

Abstract

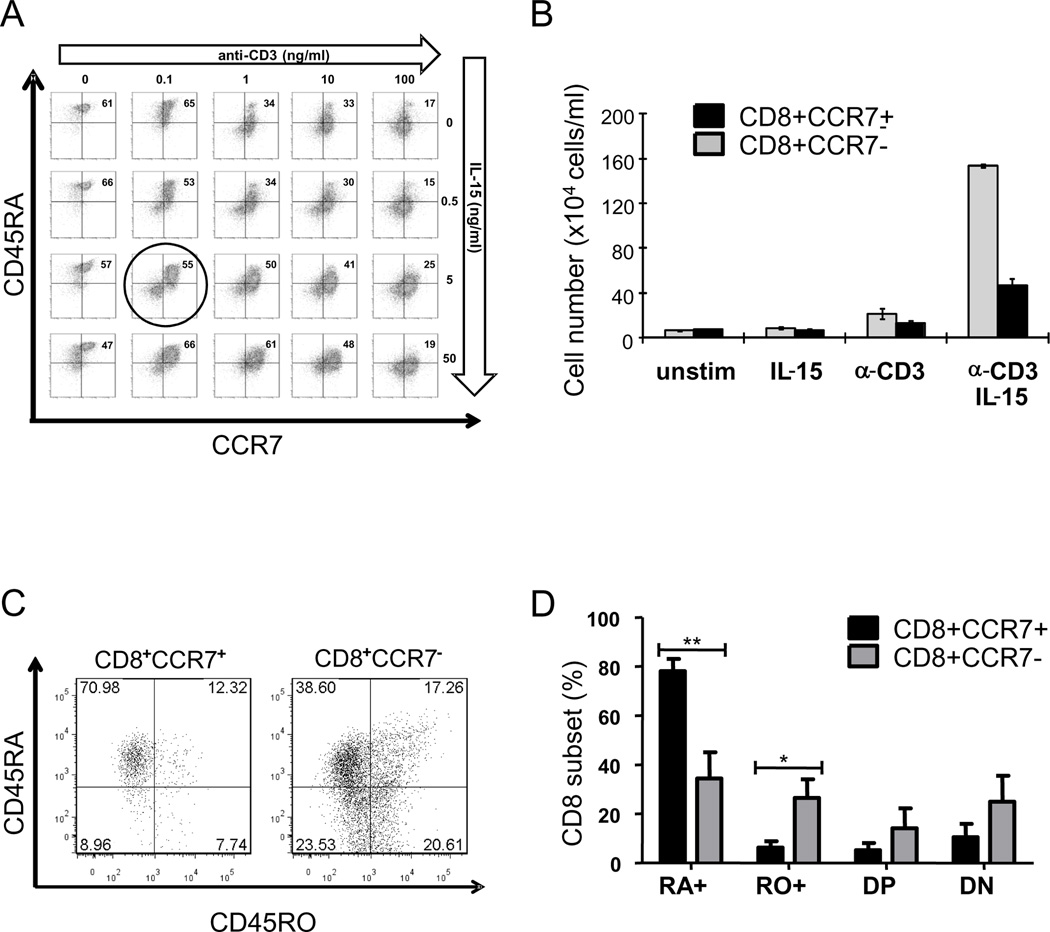
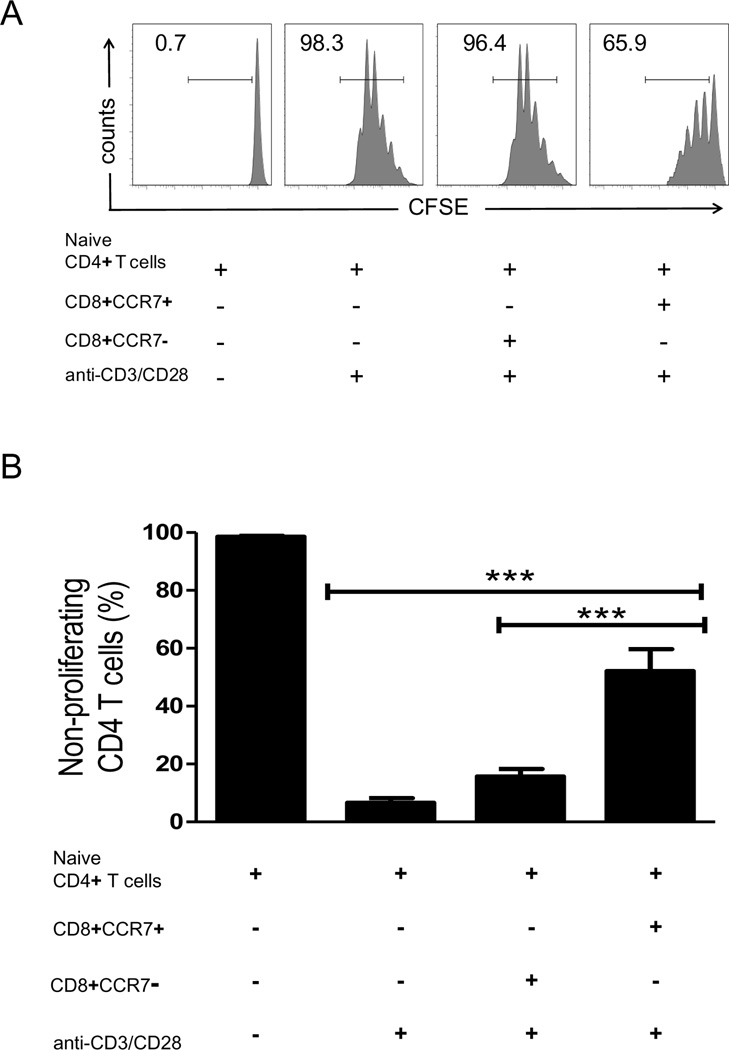
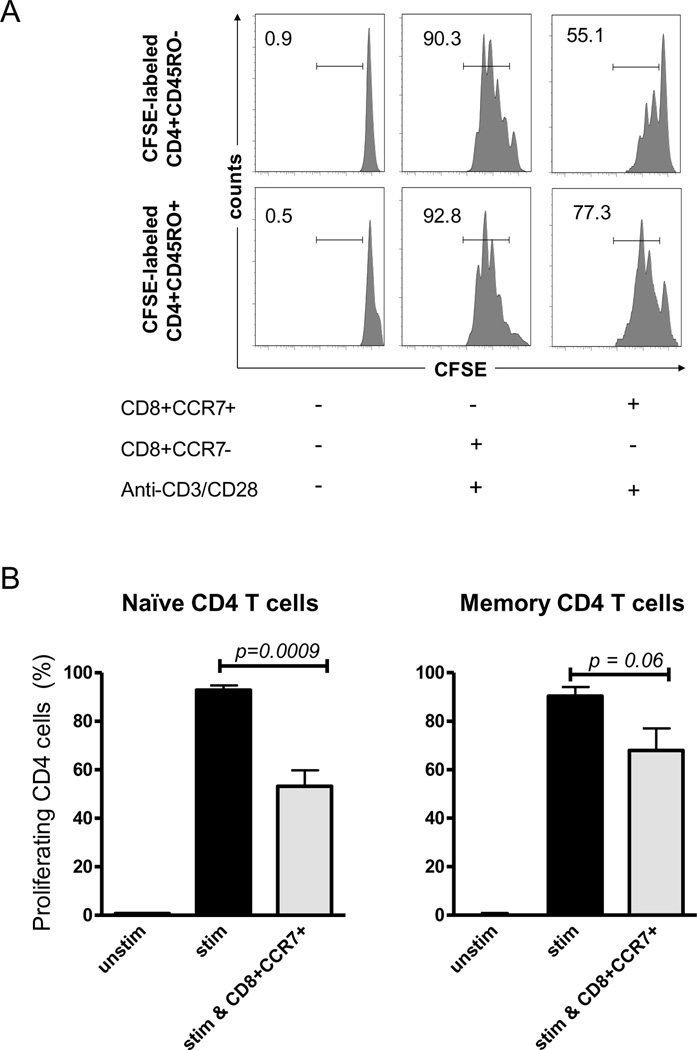
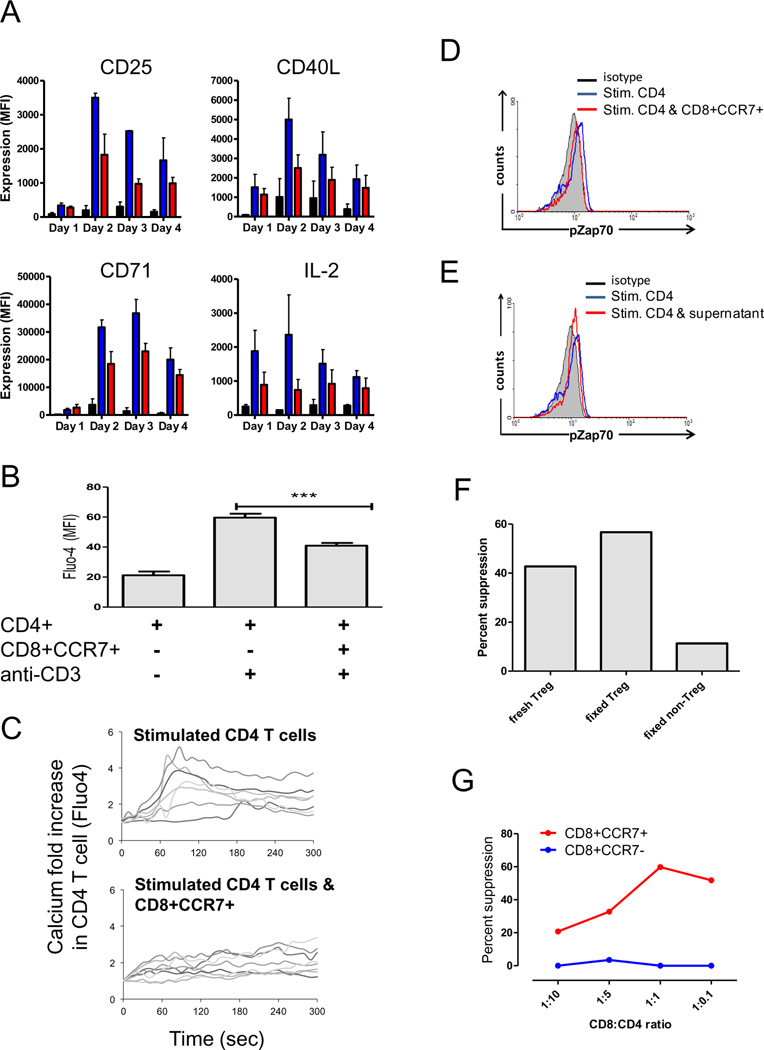
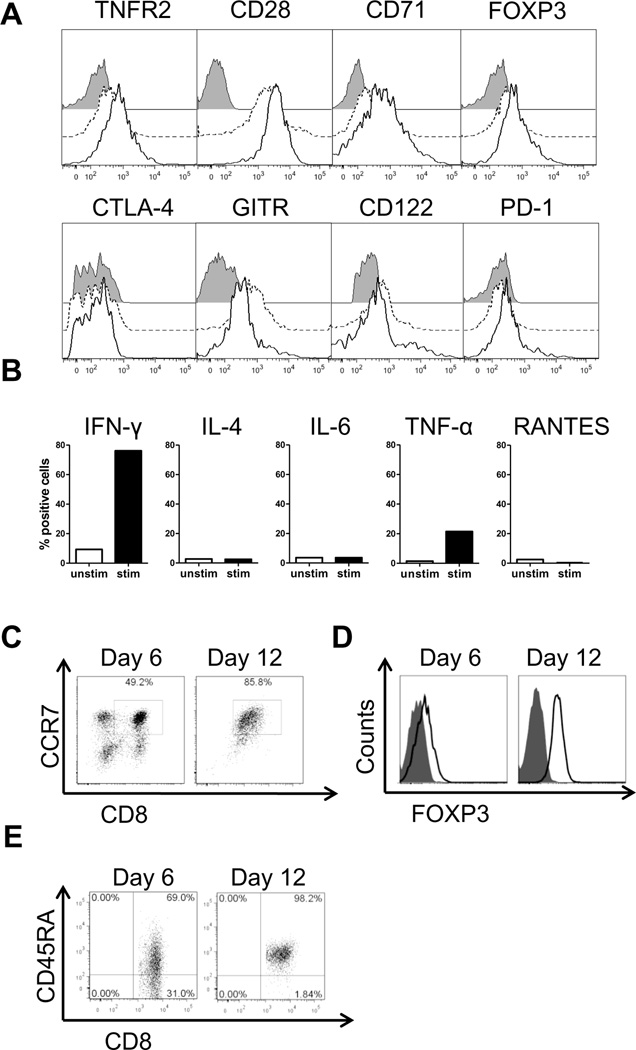
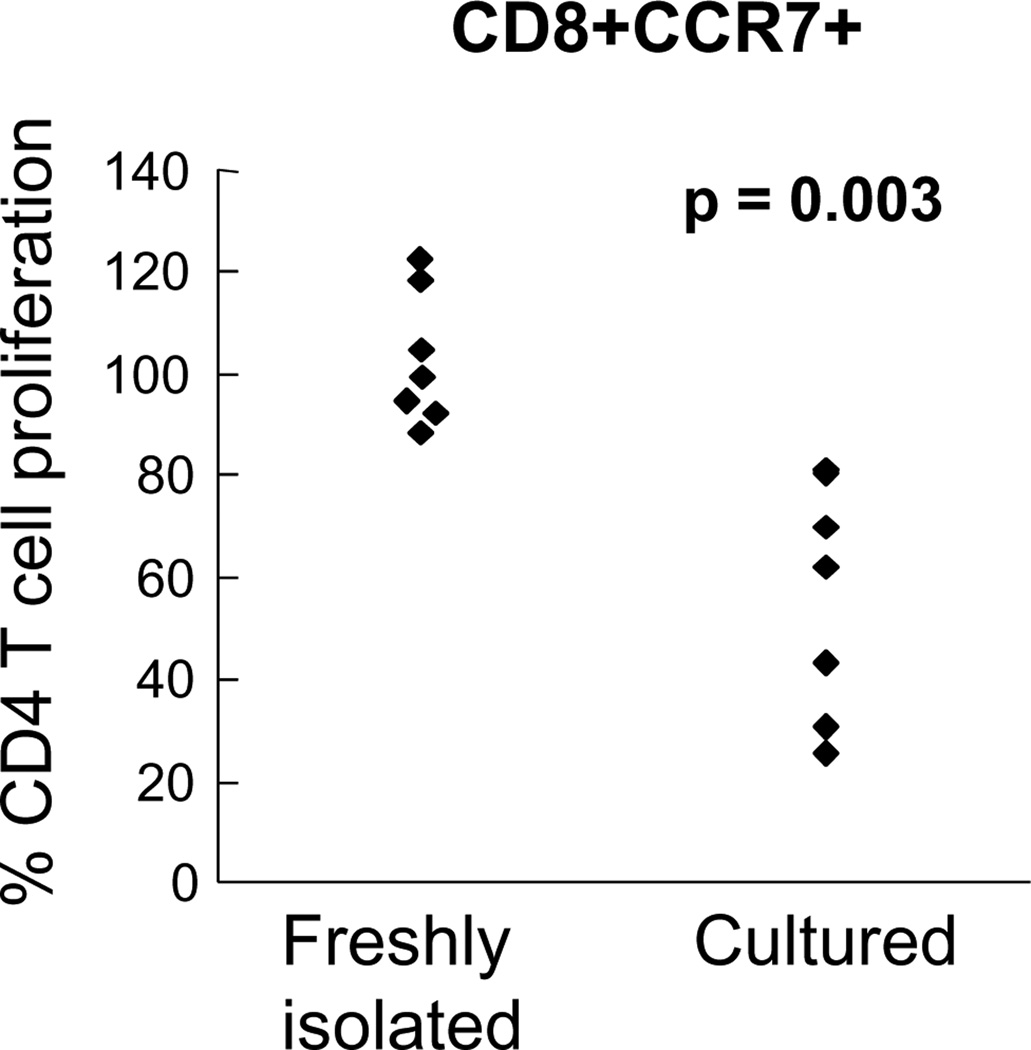
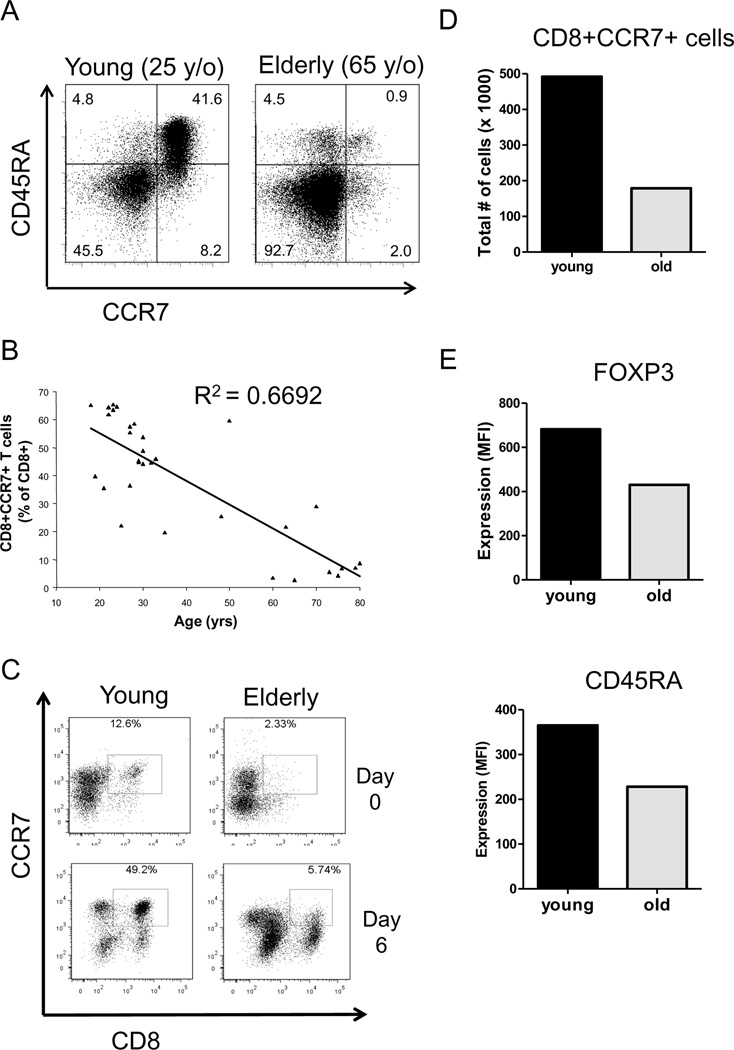
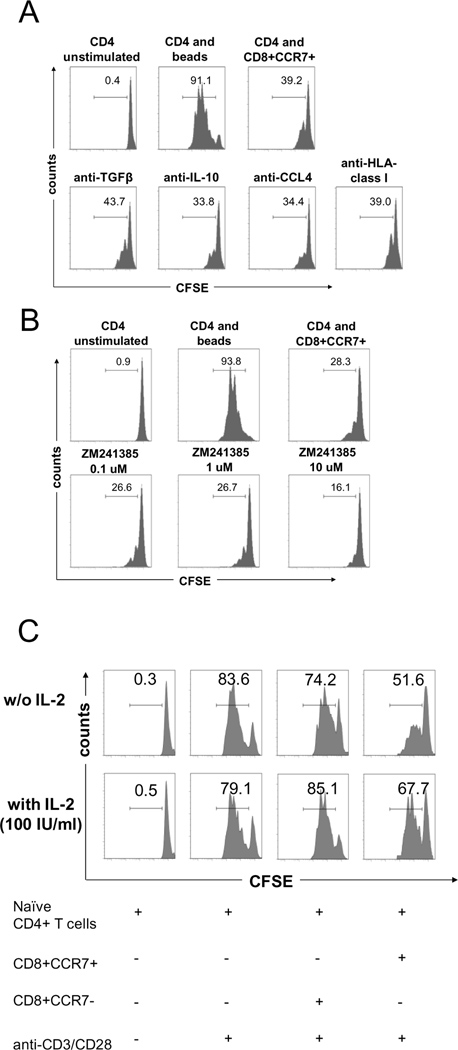
CD8 T cells stimulated with a suboptimal dose of anti-CD3 Abs (100 pg/ml) in the presence of IL-15 retain a naive phenotype with expression of CD45RA, CD28, CD27, and CCR7 but acquire new functions and differentiate into immunosuppressive T cells. CD8+CCR7+ regulatory T cells (Tregs) express FOXP3 and prevent CD4 T cells from responding to TCR stimulation and entering the cell cycle. Naive CD4 T cells are more susceptible to inhibition than memory cells. The suppressive activity of CD8+CCR7+ Tregs is not mediated by IL-10, TGF-β, CTLA-4, CCL4, or adenosine and relies on interference with very early steps of the TCR signaling cascade. Specifically, CD8+CCR7+ Tregs prevent TCR-induced phosphorylation of ZAP70 and dampen the rise of intracellular calcium in CD4 T cells. The inducibility of CD8+CCR7+ Tregs is correlated with the age of the individual with PBLs of donors older than 60 y yielding low numbers of FOXP3(low) CD8 Tregs. Loss of CD8+CCR7+ Tregs in the elderly host may be of relevance in the aging immune system as immunosenescence is associated with a state of chronic smoldering inflammation.


Conflict of interest statement

Disclosures

The authors have no financial conflicts of interest.

Figures

Figure 1
Figure 1. Induction and expansion of CD8+CCR7+ T cells
(A). PBMCs were collected from healthy individuals, plated at 2×10⁶ per well and stimulated with anti-CD3 Abs at increasing doses. Recombinant human IL-15 at concentrations of 0–50 ng/ml was added at the beginning of the culture period. On day 6, cells were harvested and stained with Abs specific for CD8, CD45RA and CCR7 and analyzed by flow cytometry. Conditions used in subsequent experiments are indicated by a circle. (B) Cells were cultured with (0.1 ng/ml) or without anti-CD3, with (5 ng/ml) or without IL-15 or the combination of anti-CD3 and IL-15. On day 6, cell numbers of CD8+CCR7 and CD8+CCR7+ cells were quantified by flow cytometry. Results are expressed as mean cell recovery ± SEM. (C) Cells were induced with anti-CD3 (0.1 ng/ml) and IL-15 (5 ng/ml) over a six-day culture, stained with anti-CD8, anti-CCR7, anti-CD45RA and anti CD45RO antibodies and analyzed by flow cytometry. Expression of CD45RA and CD45RO was determined on cells gated for CD8+CCR7+ (left) and CD8+CCR7 (right). A representative scatterblot is shown. (D) The percentage of CD45RA single positive (RA+), CD45RO single positive (RO+), CD45RA and CD45RO double positive (DP) and double negative (DN) cells is shown for day 6 CD8+CCR7+ (black bars) and CD8+CCR7 (gray bars) cells as the mean ± SEM of four independent experiments. ** p<0.005; * p<0.05.
Figure 2
Figure 2. CD8+CCR7+ T cells suppress the proliferation of CD4 T cells
CD8+CCR7 and CD8+CCR7+ T cells were generated as described in Fig. 1A. On day 6, both cell populations were purified and cocultured at a 1:1 ratio with CFSE-labeled CD4+CD45RA+ cells that were isolated from the same donor. Cocultures were stimulated with anti-CD3/CD28-coupled beads, added at a concentration of one bead per CD4 T cell. On day 4 of the coculture, proliferation of the CD4 T cells was analyzed by quantifying CFSE dilution using flow cytometry. (A) Histograms from a representative experiment are shown. Numbers represent the fraction of proliferating CD4 T cells. (B) The mean percentage ± SEM of nonproliferating CD4 T cells is shown for nine independent coculture experiments. *** p<0.0001.
Figure 3
Figure 3. Naïve CD4+ T cells are more susceptible to the suppressive effect of CD8+CCR7+ Treg cells
CD8+ CCR7 and CD8+CCR7+ T cells were purified after six days of activation with anti-CD3 (0.1 ng/ml) and IL-15 (5 ng/ml). CD4+CD45RA+ and CD4+CD45RO+ T cells derived from the same donor were labeled with CFSE and stimulated with anti-CD3/CD28 beads in the absence and presence of CD8+CCR7+ or CD8+CCR7 T cells. (A) CFSE dilution histograms are shown from a representative experiment. The frequency of proliferating CD4 T cells is indicated above each histogram. (B) Results of four independent experiments are shown as the mean ± SEM.
Figure 4
Figure 4. CD8+CCR7+ Tregs interfere with early steps in the CD4 T cell activation cascade
(A) Cocultures of CD8+CCR7+ Tregs and CD4+CD45RA+ T cells were set up as outlined in Fig. 2. After 24, 48, 72 and 96 h, CD4+ T cells were analyzed for the expression of early (CD25, CD40L) and late (CD71) activation markers by flow cytometry. The frequency of IL-2–producing CD4+ T cells was measured by intracellular staining. Mean MFI ± SEM is shown for three independent experiments. (B) CD4 T cells were loaded with the [Ca2+]i indicator dye Fluo-4/AM and mixed with CD8+CCR7+ Tregs (induced as described in Fig. 1) at a 1:1 ratio. After adding anti-CD3/CD28-coupled beads, cells were immediately analyzed by confocal microscopy. Mean fluorescence intensity of Fluo-4 was measured after 2 min in CD4 T cells that were unconnected to beads (left bar), CD4 T cells connected to beads (middle bar) and CD4 T cells in contact with beads as well as CD8 cells (right bar). Results from a minimum of 20 CD4 T cells for each condition are shown as mean ± SEM from three independent experiments. (C) [Ca2+]i traces recorded from individual CD4 T cells that were in contact with beads (top panel) or from individual CD4 T cells that were contacting CD8+CCR7+ T cells as well as anti-CD3-coupled beads. (D) CD8+CCR7+ Tregs were purified after six days of activation with anti-CD3 and IL-15. CD4+CD45RA+ T cells were isolated and stimulated with anti-CD3/CD28-coupled beads in the absence or presence of CD8+CCR7+ Tregs (ratio 1:1). After a 5 min incubation period, cells were fixed and stained for CD4 and phosphorylated ZAP70 and analyzed by flow cytometry. One representative histogram of pZAP70 expression in CD4+ T cells out of three independent experiments is shown. (E) Phosphorylated ZAP70 was measured in CD4 T cells, which were stimulated with anti-CD3/CD28 coated beads in the absence (blue line) or presence (red line) of supernatants harvested from CD8+CCR7+ Treg cultures. One representative example is shown. (F) PBMC were cultured for six days with anti-CD3 and IL-15 as described in Fig. 1. CD8+CCR7+ were isolated and either left untreated (fresh Tregs) or treated with PFA (fixed Treg). PFA-fixed CD8+CCR7 T cells served as control. The suppressive activity of all three Tregs populations was analyzed by mixing them at a 1:1 ratio with CD4 T cells activated by anti-CD3-coupled beads. CD4 T cell activation was quantified by measuring pZAP70 expression after 5 min of stimulation as described in Fig. 4C. Percent suppression was calculated based on pZAP70 MFI in cocultures versus pZAP70 MFI in CD4 T cells stimulated alone. One representative out of two experiments is shown. (G) CD8+CCR7+ Tregs were purified after six days of induction with anti-CD3 and IL-15. CD4+CD45RA+ T cells were isolated, stimulated with anti-CD3/CD28-coupled beads and mixed at increasing ratios with either CD8+CCR7+ Tregs (red line) or CD8+CCR7 T cells (blue line). After a 5 min incubation period, cells were fixed and stained for CD4 and phosphorylated ZAP70 and analyzed by flow cytometry. Percent suppression was calculated as in Fig. 4D and is shown for one representative out of two independent experiments for CD8 to CD4 T cell ratios of 1:10, 1:5, 1:1 and 1:0.1.
Figure 5
Figure 5. Phenotype and cytokine production profile of CD8+CCR7+ Treg cells
(A) PBMCs were collected from healthy donors. CD8+CCR7+ T cells were induced and expanded with anti-CD3 (0.1 ng/ml) and IL-15 (5 ng/ml) as described in Fig. 1 and harvested on day 6. Cells were phenotyped by flow cytometry using antibodies to CD8, CCR7, TNFR2, CD28, CD71, FOXP3, CTLA-4, GITR, CD122 and PD-1. One histogram representative of five experiments is shown for CD8+CCR7+ Tregs (solid line) and CD8+CCR7 T cells (dashed line). Fluorescence minus one (FMO) controls are presented as filled histograms. (B) Expression of IFN-γ, IL-4, IL-6, TNF-α and RANTES was measured in nonstimulated (open bars) and PMA/ionomycin stimulated (black bars) CD8+CCR7+ Tregs using intracellular staining and flow cytometry. Cells were stimulated with PMA/ionomycin for 4 h in the presence of brefeldin A. The percentage of cytokine positive CD8+CCR7+ cells is shown for one representative out of two experiments. (C–E) PBMC were cultured with anti-CD3 (0.1 ng/ml) and IL-15 (5 ng/ml) for six days. At day 6, cells were washed and kept for an additional six days with only IL-15 (5 ng/ml). Expression of CD8 and CCR7 was analyzed at days 6 and 12 by flow cytometry and a representative scatterblot is shown in (C) FOXP3 expression in CD8+CCR7+ cells at days 6 and 12 is shown as a solid line and the FMO as a filled histogram in D. CD45RA expression on CD8+ T cells at days 6 and 12 is presented in E. For C–E, one representative example out of three independent experiments is shown.
Figure 6
Figure 6. Induction of CD8+CCR7+ Tregs
CD8+CCR7+ T cells were either purified from fresh PBMCs or from cultures stimulated for six days with anti-CD3 (0.1 ng/ml) and IL-15 (5 ng/ml). CD4+CD45RA+ T cells were isolated from the same donor, labeled with CFSE and cocultured with the CD8 T cells and anti-CD3/CD28 beads as described above. Proliferation of CD4 T cells was assessed by CFSE dilution and relative proliferation was determined as the percentage of CD4 T cells proliferating in the absence and presence of CD8+CCR7+ Tregs.
Figure 7
Figure 7. Induction of CD8+CCR7+ Tregs is impaired in elderly individuals
PBMCs were isolated from healthy individuals 18 to 81 years old and stimulated with anti-CD3 and IL-15 as described. On day 6, cells were harvested, stained with anti-CD8, anti-CD45RA and anti-CCR7 antibodies and analyzed by flow cytometry. (A) Representative results from a young (25 years; left) and an elderly donor (65 years; right) are shown. (B) The frequency of induced CD8+CCR7+ cells is plotted against the age of the donor. (C) Expression of CD8 and CCR7 is compared for a representative young and old donor on day 0 and day 6. (D) The total number of CD8+CCR7+ cells recovered at day 6 is shown for one representative experiment. (E) Expression of FOXP3 and CD45RA was analyzed by flow cytometry in day-6 CD8+CCR7+ cells derived from young (black bars) and old (grey bars) individuals. One representative out of three experiments is shown.
Figure 8
Figure 8. CD8+CCR7+ Treg-mediated suppression is independent of TGF-β, IL-10, CCL4, adenosine or HLA-class I recognition
CD8+CCR7+ Tregs and CD4+CD45RA+ T cells were prepared and cocultured as outlined in Fig. 2. Proliferation of CD4 T cells was quantified by CFSE dilution after 96 h of coculture. (A) Abs reactive to TGF-β (100 μg/ml), IL-10 (100 μg/ml), CCL4 (100 μg/ml) or HLA-class I molecules (100 μg/ml) were added at the beginning of the cocultures. (B) Varying doses of the small molecule inhibitor ZM241385 which blocks the adenosine A2A receptor were added to the cocultures at day 0. (C) Cocultures were supplemented with exogenous IL-2 at the beginning of the culture period. Results for 100 U/ml of recombinant human IL-2 are shown.

Similar articles

Cited by

References

    1. Sakaguchi S, Yamaguchi T, Nomura T, Ono M. Regulatory T cells and immune tolerance. Cell. 2008;133:775–787. - PubMed
    1. Belkaid Y, Tarbell K. Regulatory T cells in the control of host-microorganism interactions (*) Annu Rev Immunol. 2009;27:551–589. - PubMed
    1. Zheng Y, Rudensky AY. Foxp3 in control of the regulatory T cell lineage. Nat Immunol. 2007;8:457–462. - PubMed
    1. Ziegler SF. FOXP3: of mice and men. Annu Rev Immunol. 2006;24:209–226. - PubMed
    1. Wang J, Ioan-Facsinay A, van der Voort EI, Huizinga TW, Toes RE. Transient expression of FOXP3 in human activated nonregulatory CD4+ T cells. Eur J Immunol. 2007;37:129–138. - PubMed

Publication types

MeSH terms