

Processing and analysis of cardiac optical mapping data obtained with potentiometric dyes
- PMID: 22821993
- PMCID: PMC3469699
- DOI: 10.1152/ajpheart.00404.2012
Processing and analysis of cardiac optical mapping data obtained with potentiometric dyes
Abstract
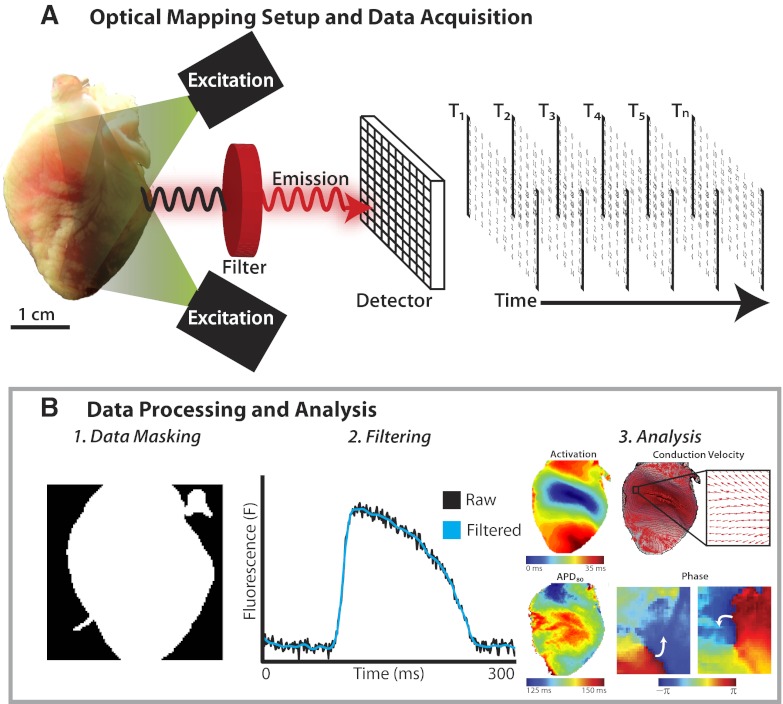
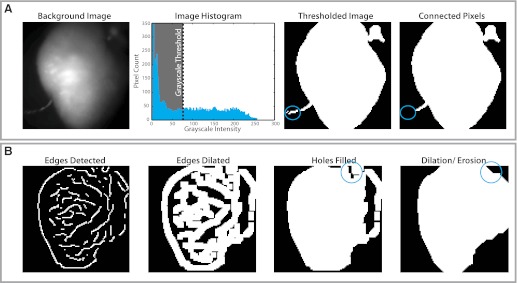
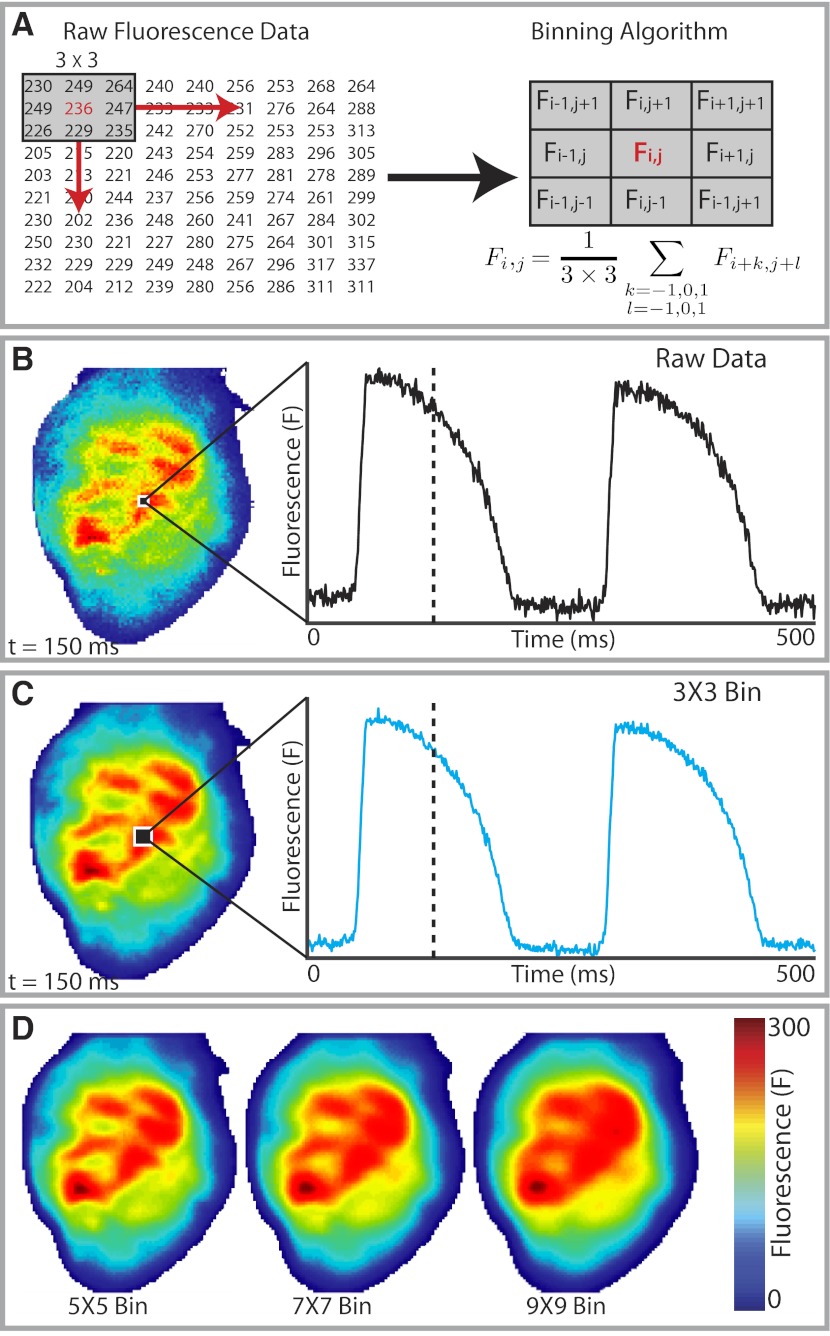
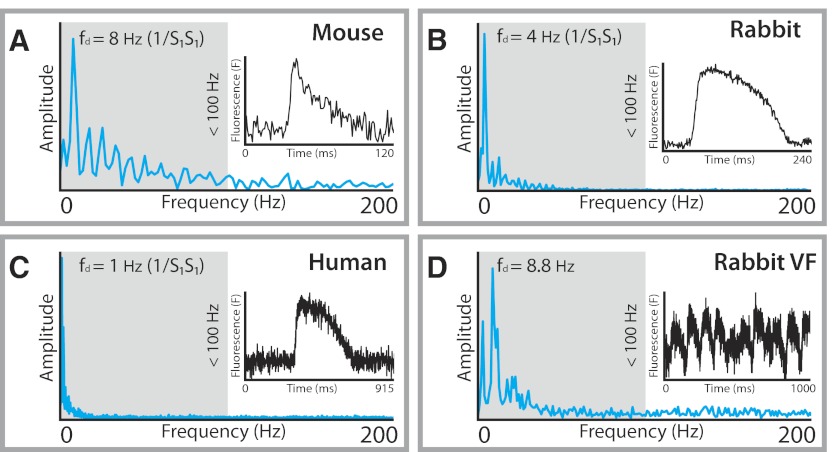
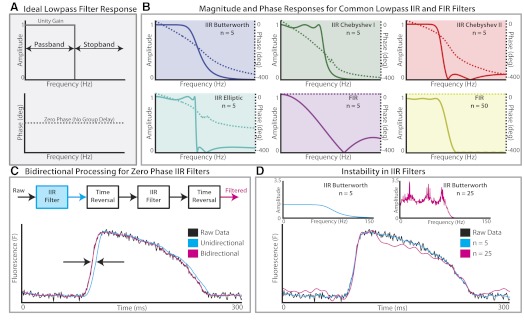
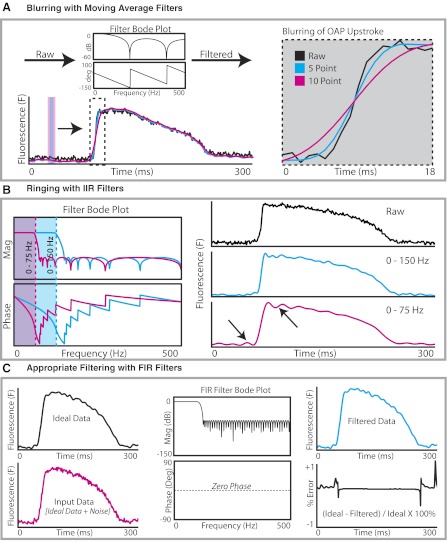
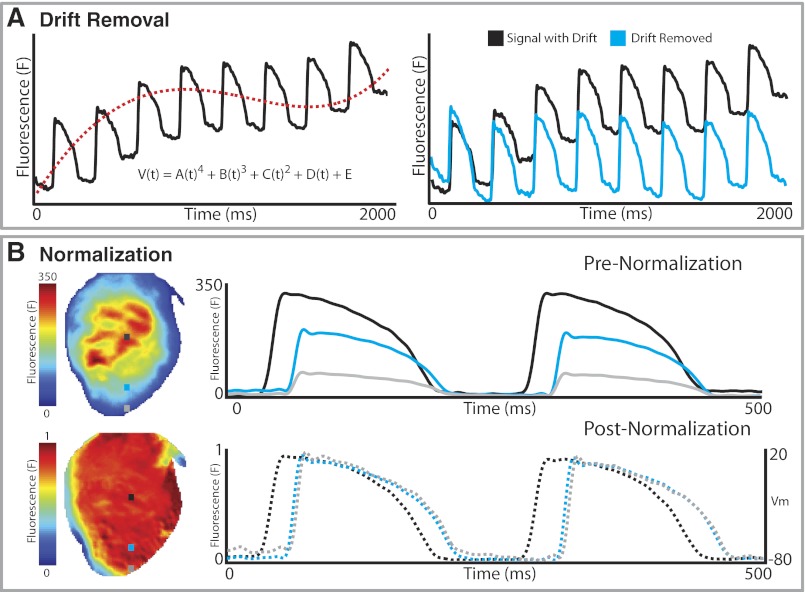
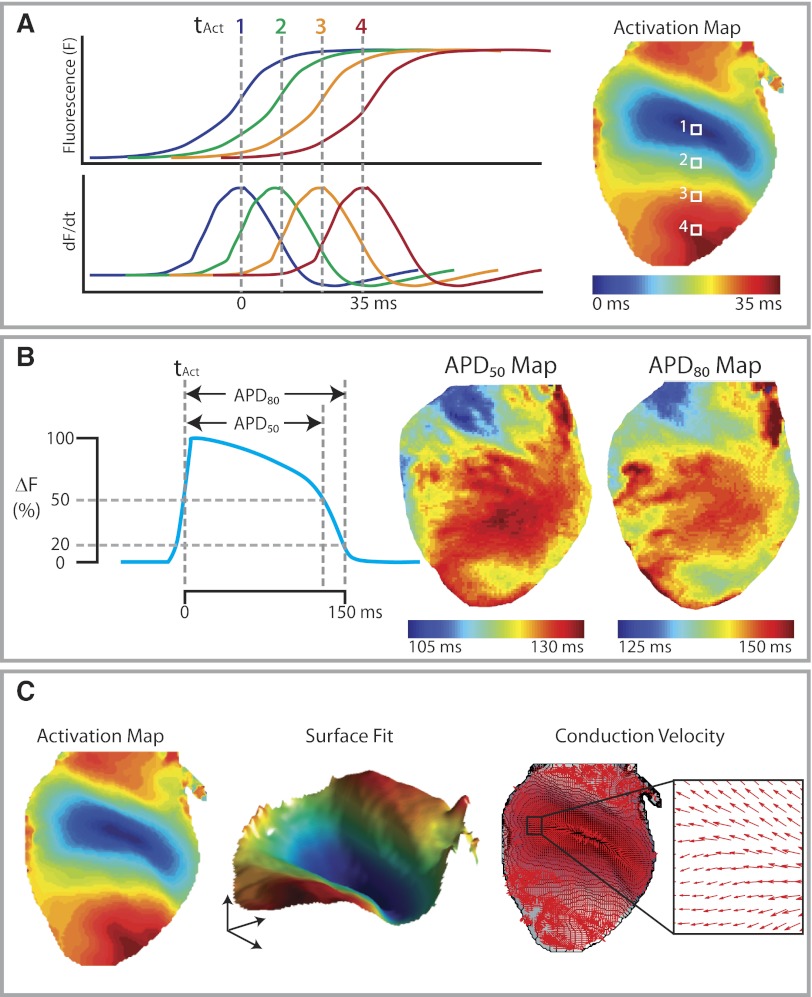
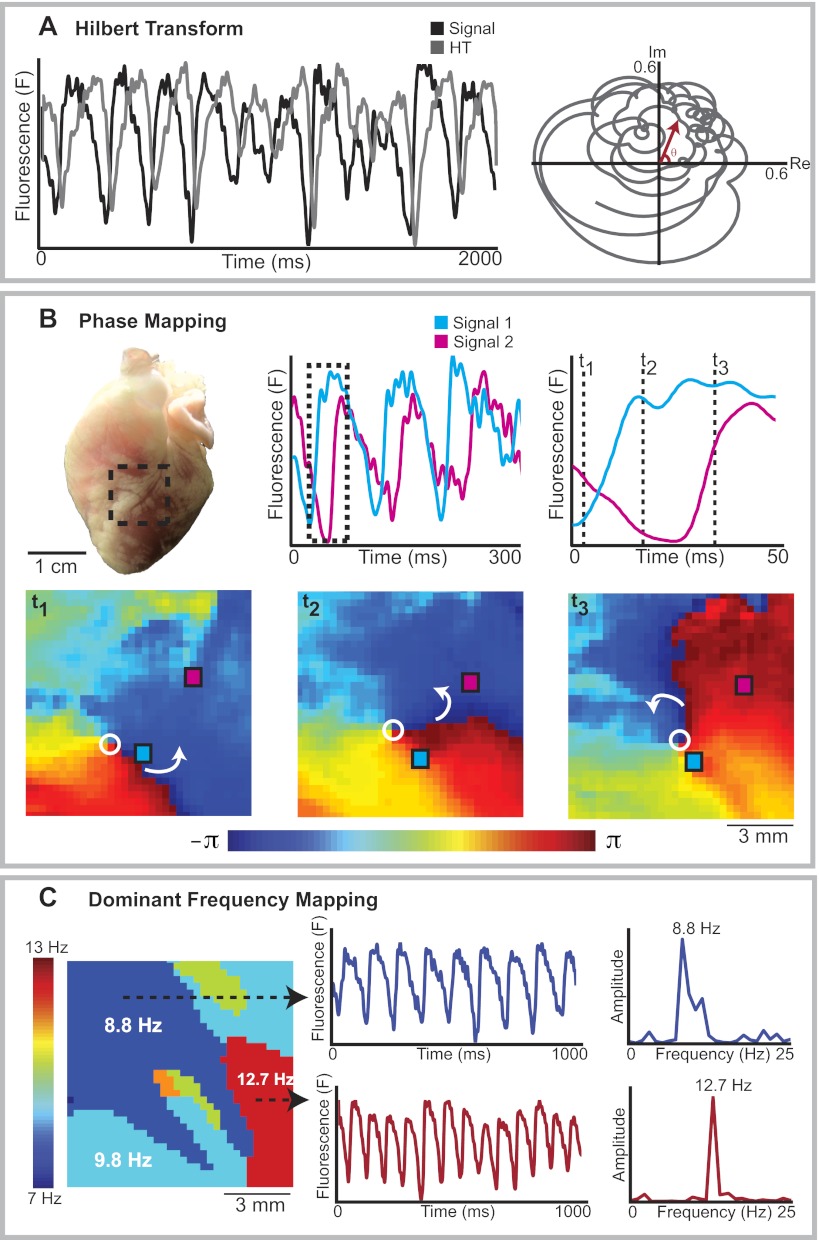
Optical mapping has become an increasingly important tool to study cardiac electrophysiology in the past 20 years. Multiple methods are used to process and analyze cardiac optical mapping data, and no consensus currently exists regarding the optimum methods. The specific methods chosen to process optical mapping data are important because inappropriate data processing can affect the content of the data and thus alter the conclusions of the studies. Details of the different steps in processing optical imaging data, including image segmentation, spatial filtering, temporal filtering, and baseline drift removal, are provided in this review. We also provide descriptions of the common analyses performed on data obtained from cardiac optical imaging, including activation mapping, action potential duration mapping, repolarization mapping, conduction velocity measurements, and optical action potential upstroke analysis. Optical mapping is often used to study complex arrhythmias, and we also discuss dominant frequency analysis and phase mapping techniques used for the analysis of cardiac fibrillation.
Figures
References
-
- Bayly PV, KenKnight BH, Rogers JM, Hillsley RE, Ideker RE, Smith WM. Estimation of conduction velocity vector fields from epicardial mapping data. IEEE Trans Biomed Eng 45: 563–571, 1998 - PubMed
Publication types
MeSH terms
Substances
Grants and funding
LinkOut - more resources
Full Text Sources
Other Literature Sources
Medical
Miscellaneous