

Closed-loop neural stimulation for pentylenetetrazole-induced seizures in zebrafish
- PMID: 22822044
- PMCID: PMC3529339
- DOI: 10.1242/dmm.009423
Closed-loop neural stimulation for pentylenetetrazole-induced seizures in zebrafish
Abstract
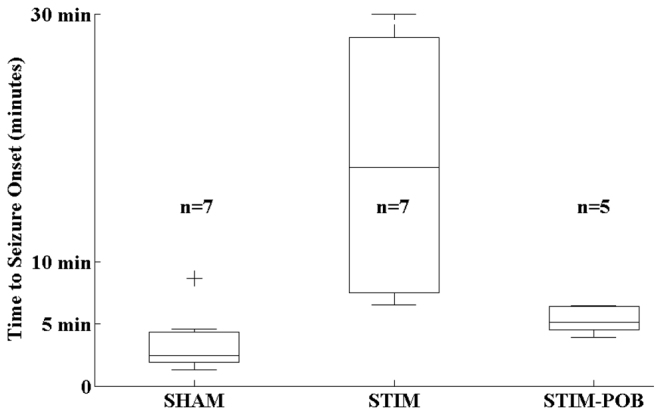
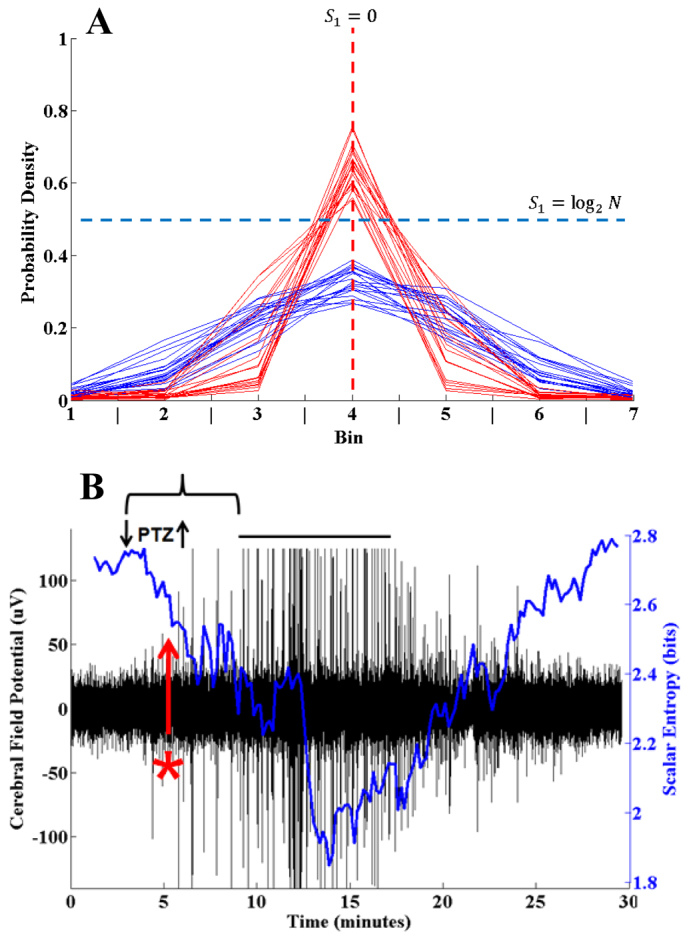
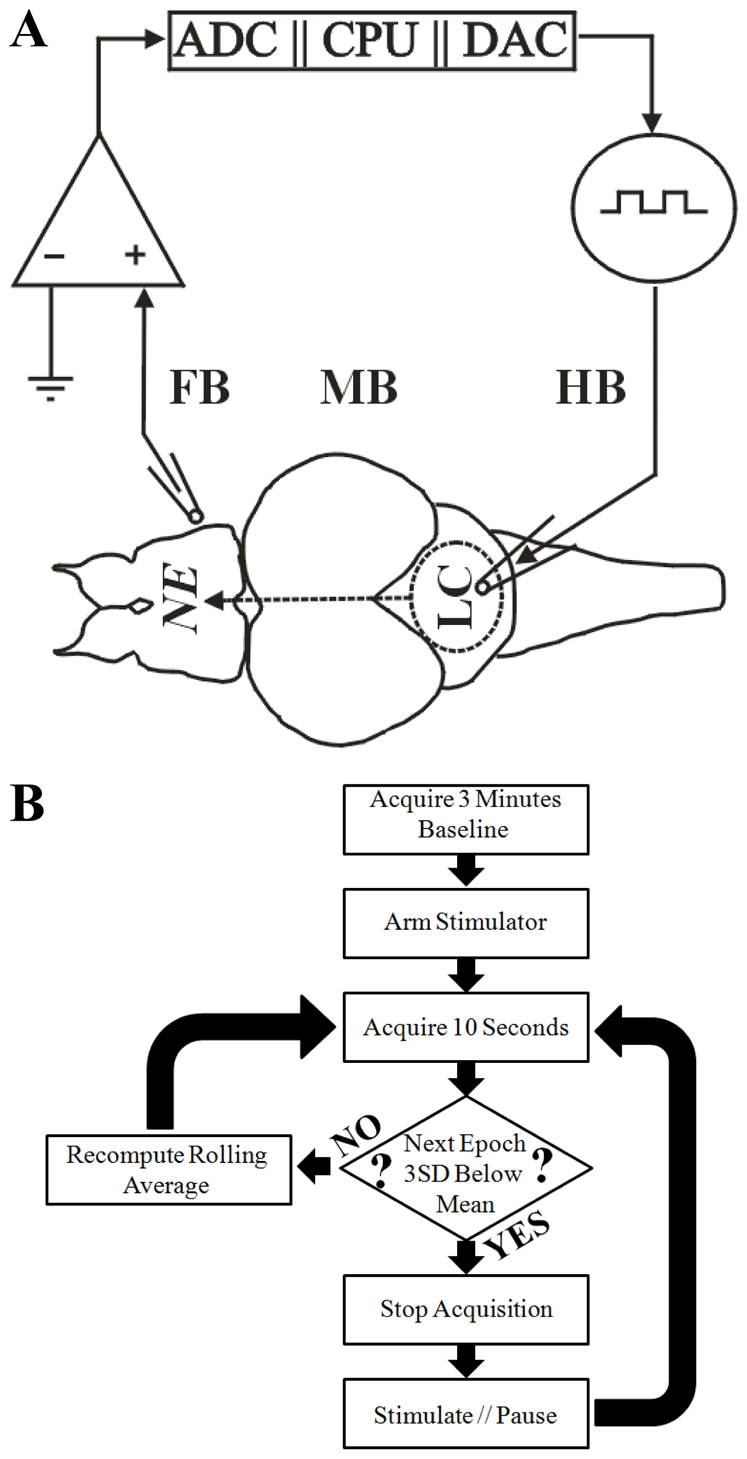
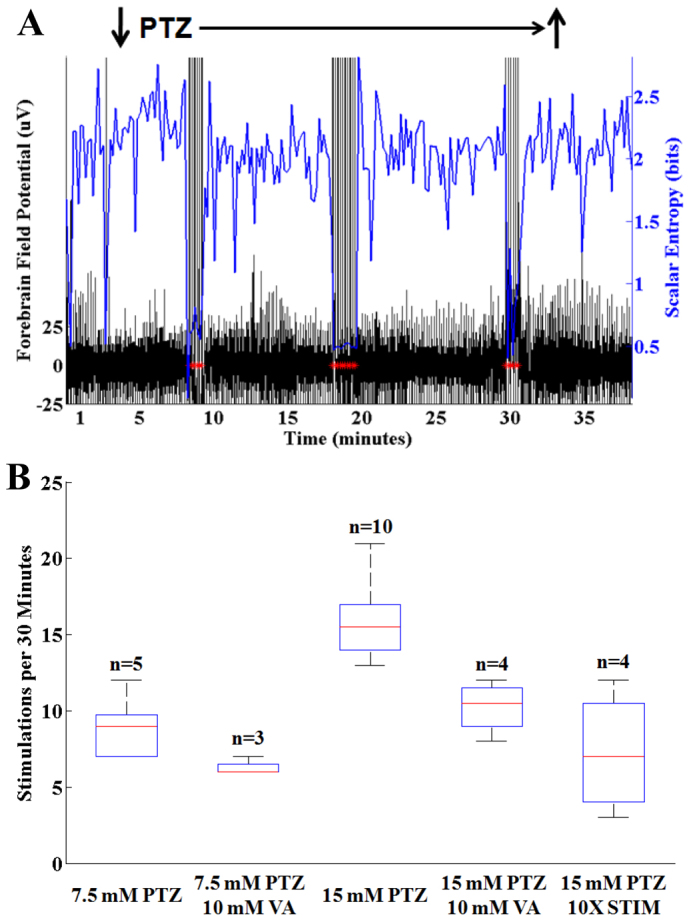
Neural stimulation can reduce the frequency of seizures in persons with epilepsy, but rates of seizure-free outcome are low. Vagus nerve stimulation prevents seizures by continuously activating noradrenergic projections from the brainstem to the cortex. Cortical norepinephrine then increases GABAergic transmission and increases seizure threshold. Another approach, responsive nervous stimulation, prevents seizures by reactively shocking the seizure onset zone in precise synchrony with seizure onset. The electrical shocks abort seizures before they can spread and manifest clinically. The goal of this study was to determine whether a hybrid platform in which brainstem activation triggered in response to impending seizure activity could prevent seizures. We chose the zebrafish as a model organism for this study because of its ability to recapitulate human disease, in conjunction with its innate capacity for tightly controlled high-throughput experimentation. We first set out to determine whether electrical stimulation of the zebrafish hindbrain could have an anticonvulsant effect. We found that pulse train electrical stimulation of the hindbrain significantly increased the latency to onset of pentylenetetrazole-induced seizures, and that this apparent anticonvulsant effect was blocked by noradrenergic antagonists, as is also the case with rodents and humans. We also found that the anticonvulsant effect of hindbrain stimulation could be potentiated by reactive triggering of single pulse electrical stimulations in response to impending seizure activity. Finally, we found that the rate of stimulation triggering was directly proportional to pentylenetetrazole concentration and that the stimulation rate was reduced by the anticonvulsant valproic acid and by larger stimulation currents. Taken as a whole, these results show that that the anticonvulsant effect of brainstem activation can be efficiently utilized by reactive triggering, which suggests that alternative stimulation paradigms for vagus nerve stimulation might be useful. Moreover, our results show that the zebrafish epilepsy model can be used to advance our understanding of neural stimulation in the treatment of epilepsy.
Figures
Similar articles
-
Pharmacometabolic Effects of Pteryxin and Valproate on Pentylenetetrazole-Induced Seizures in Zebrafish Reveal Vagus Nerve Stimulation.Cells. 2023 Jun 4;12(11):1540. doi: 10.3390/cells12111540. Cells. 2023. PMID: 37296660 Free PMC article.
-
Reduction of pentylenetetrazole-induced seizure activity in awake rats by seizure-triggered trigeminal nerve stimulation.J Neurosci. 2000 Nov 1;20(21):8160-8. doi: 10.1523/JNEUROSCI.20-21-08160.2000. J Neurosci. 2000. PMID: 11050139 Free PMC article.
-
Anticonvulsant activity of bisabolene sesquiterpenoids of Curcuma longa in zebrafish and mouse seizure models.Epilepsy Behav. 2012 May;24(1):14-22. doi: 10.1016/j.yebeh.2012.02.020. Epub 2012 Apr 5. Epilepsy Behav. 2012. PMID: 22483646
-
Experimental Models for the Discovery of Novel Anticonvulsant Drugs: Focus on Pentylenetetrazole-Induced Seizures and Associated Memory Deficits.Curr Pharm Des. 2020;26(15):1693-1711. doi: 10.2174/1381612826666200131105324. Curr Pharm Des. 2020. PMID: 32003682 Review.
-
The anticonvulsant effect of electrical fields.Curr Neurol Neurosci Rep. 2001 Mar;1(2):155-61. doi: 10.1007/s11910-001-0011-0. Curr Neurol Neurosci Rep. 2001. PMID: 11898511 Review.
Cited by
-
Noninvasive Multielectrode Array for Brain and Spinal Cord Local Field Potential Recordings from Live Zebrafish Larvae.Zebrafish. 2020 Aug;17(4):271-277. doi: 10.1089/zeb.2020.1874. Epub 2020 Aug 4. Zebrafish. 2020. PMID: 32758083 Free PMC article.
-
A Systematic Review on Non-mammalian Models in Epilepsy Research.Front Pharmacol. 2018 Jun 27;9:655. doi: 10.3389/fphar.2018.00655. eCollection 2018. Front Pharmacol. 2018. PMID: 29997502 Free PMC article.
-
The role of local field potential coupling in epileptic synchronization.Neural Regen Res. 2013 Mar 15;8(8):745-53. doi: 10.3969/j.issn.1673-5374.2013.08.009. Neural Regen Res. 2013. PMID: 25206721 Free PMC article.
-
Seizures induced by pentylenetetrazole in the adult zebrafish: a detailed behavioral characterization.PLoS One. 2013;8(1):e54515. doi: 10.1371/journal.pone.0054515. Epub 2013 Jan 21. PLoS One. 2013. PMID: 23349914 Free PMC article.
-
Pharmacometabolic Effects of Pteryxin and Valproate on Pentylenetetrazole-Induced Seizures in Zebrafish Reveal Vagus Nerve Stimulation.Cells. 2023 Jun 4;12(11):1540. doi: 10.3390/cells12111540. Cells. 2023. PMID: 37296660 Free PMC article.
References
-
- Abásolo D., Escudero J., Hornero R., Gómez C., Espino P. (2008). Approximate entropy and auto mutual information analysis of the electroencephalogram in Alzheimer’s disease patients. Med. Biol. Eng. Comput. 46, 1019–1028 - PubMed
-
- Aldenkamp A. P. (2006). Cognitive impairment in epilepsy: State of affairs and clinical relevance. Seizure 15, 219–220
-
- Anderson W., Kossoff E., Bergey G., Jallo G. (2008). Implantation of a responsive neurostimulator device in patients with refractory epilepsy. Neurosurg. Focus 25, E12 - PubMed
-
- Baraban S. C., Taylor M. R., Castro P. A., Baier H. (2005). Pentylenetetrazole induced changes in zebrafish behavior, neural activity and c-fos expression. Neuroscience 131, 759–768 - PubMed
-
- Barry D. I., Wanscher B., Kragh J., Bolwig T. G., Kokaia M., Brundin P., Björklund A., Lindvall O. (1989). Grafts of fetal locus coeruleus neurons in rat amygdala-piriform cortex suppress seizure development in hippocampal kindling. Exp Neurol. 106, 125–132 - PubMed
Publication types
MeSH terms
Substances
Grants and funding
LinkOut - more resources
Full Text Sources
Medical
