Influenza A virus infection of human respiratory cells induces primary microRNA expression
- PMID: 22822053
- PMCID: PMC3438935
- DOI: 10.1074/jbc.M112.387670
Influenza A virus infection of human respiratory cells induces primary microRNA expression
Abstract
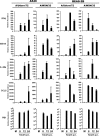
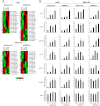
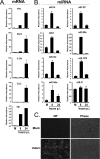
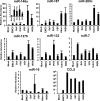
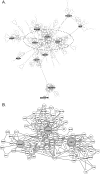
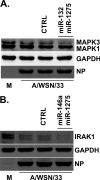
The cellular response to virus infection is initiated by recognition of the invading pathogen and subsequent changes in gene expression mediated by both transcriptional and translational mechanisms. In addition to well established means of regulating antiviral gene expression, it has been demonstrated that RNA interference (RNAi) can play an important role in antiviral responses. Virus-derived small interfering RNA (siRNA) is a primary antiviral response exploited by plants and invertebrate animals, and host-encoded microRNA (miRNA) species have been clearly implicated in the regulation of innate and adaptive immune responses in mammals and other vertebrates. Examination of miRNA abundance in human lung cell lines revealed endogenous miRNAs, including miR-7, miR-132, miR-146a, miR-187, miR-200c, and miR-1275, to specifically accumulate in response to infection with two influenza A virus strains, A/Udorn/72 and A/WSN/33. Known antiviral response pathways, including Toll-like receptor, RIG-I-like receptor, and direct interferon or cytokine stimulation did not alter the abundance of the tested miRNAs to the extent of influenza A virus infection, which initiates primary miRNA transcription via a secondary response pathway. Gene expression profiling identified 26 cellular mRNAs targeted by these miRNAs, including IRAK1, MAPK3, and other components of innate immune signaling systems.
Figures


Similar articles
-
The microRNA miR-485 targets host and influenza virus transcripts to regulate antiviral immunity and restrict viral replication.Sci Signal. 2015 Dec 8;8(406):ra126. doi: 10.1126/scisignal.aab3183. Sci Signal. 2015. PMID: 26645583
-
MicroRNA-146a induction during influenza H3N2 virus infection targets and regulates TRAF6 levels in human nasal epithelial cells (hNECs).Exp Cell Res. 2017 Mar 15;352(2):184-192. doi: 10.1016/j.yexcr.2017.01.011. Epub 2017 Jan 25. Exp Cell Res. 2017. PMID: 28131813
-
Host microRNA molecular signatures associated with human H1N1 and H3N2 influenza A viruses reveal an unanticipated antiviral activity for miR-146a.J Gen Virol. 2013 May;94(Pt 5):985-995. doi: 10.1099/vir.0.049528-0. Epub 2013 Jan 23. J Gen Virol. 2013. PMID: 23343627
-
Fueling influenza and the immune response: Implications for metabolic reprogramming during influenza infection and immunometabolism.Immunol Rev. 2020 May;295(1):140-166. doi: 10.1111/imr.12851. Immunol Rev. 2020. PMID: 32320072 Review.
-
[Mechanisms underlying interferon-mediated host innate immunity during influenza A virus infection].Sheng Wu Gong Cheng Xue Bao. 2015 Dec;31(12):1671-81. Sheng Wu Gong Cheng Xue Bao. 2015. PMID: 27093830 Review. Chinese.
Cited by
-
MicroRNAs and HIV-1: complex interactions.J Biol Chem. 2012 Nov 30;287(49):40884-90. doi: 10.1074/jbc.R112.415448. Epub 2012 Oct 5. J Biol Chem. 2012. PMID: 23043098 Free PMC article. Review.
-
The Effect of MicroRNA bantam on Baculovirus AcMNPV Infection in Vitro and in Vivo.Viruses. 2016 May 16;8(5):136. doi: 10.3390/v8050136. Viruses. 2016. PMID: 27196923 Free PMC article.
-
Increased expression of microRNA-155-5p by alveolar type II cells contributes to development of lethal ARDS in H1N1 influenza A virus-infected mice.Virology. 2020 Jun;545:40-52. doi: 10.1016/j.virol.2020.03.005. Epub 2020 Mar 23. Virology. 2020. PMID: 32308197 Free PMC article.
-
Up-regulation of microRNA-203 in influenza A virus infection inhibits viral replication by targeting DR1.Sci Rep. 2018 May 1;8(1):6797. doi: 10.1038/s41598-018-25073-9. Sci Rep. 2018. PMID: 29717211 Free PMC article.
-
Differential Expression of Serum Exosome microRNAs and Cytokines in Influenza A and B Patients Collected in the 2016 and 2017 Influenza Seasons.Pathogens. 2021 Feb 2;10(2):149. doi: 10.3390/pathogens10020149. Pathogens. 2021. PMID: 33540650 Free PMC article.
References
-
- Ishii K. J., Koyama S., Nakagawa A., Coban C., Akira S. (2008) Host innate immune receptors and beyond. Making sense of microbial infections. Cell Host Microbe 3, 352–363 - PubMed
-
- Ding S. W. (2010) RNA-based antiviral immunity. Nat. Rev. Immunol. 10, 632–644 - PubMed
-
- Huntzinger E., Izaurralde E. (2011) Gene silencing by microRNAs. Contributions of translational repression and mRNA decay. Nat. Rev. Genet. 12, 99–110 - PubMed
-
- Bartel D. P. (2004) MicroRNAs. Genomics, biogenesis, mechanism, and function. Cell 116, 281–297 - PubMed
Publication types
MeSH terms
Substances
Grants and funding
LinkOut - more resources
Full Text Sources
Medical
Miscellaneous

