. 2012 Aug 31;287(36):30596-609.
doi: 10.1074/jbc.M112.396432. Epub 2012 Jul 20.

Leucine-rich repeat 11 of Toll-like receptor 9 can tightly bind to CpG-containing oligodeoxynucleotides, and the positively charged residues are critical for the high affinity

Affiliations

Leucine-rich repeat 11 of Toll-like receptor 9 can tightly bind to CpG-containing oligodeoxynucleotides, and the positively charged residues are critical for the high affinity

Xichun Pan et al. J Biol Chem. .

Abstract

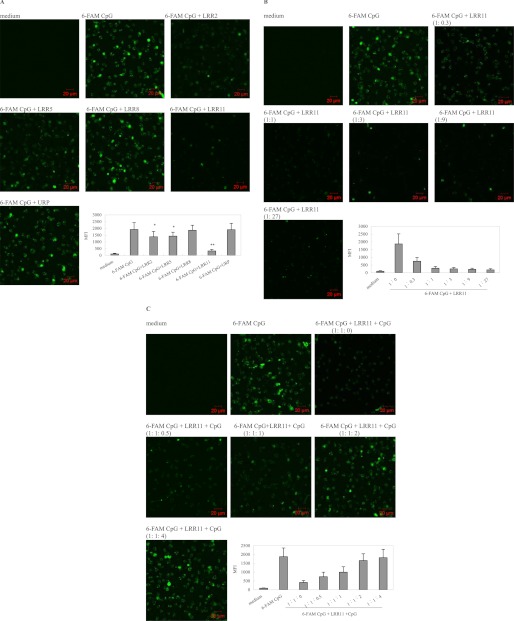
TLR9 is a receptor for sensing bacterial DNA/CpG-containing oligonucleotides (CpG ODN). The extracellular domain (ECD) of human TLR9 (hTLR9) is composed of 25 leucine-rich repeats (LRR) contributing to the binding of CpG ODN. Herein, we showed that among LRR2, -5, -8, and -11, LRR11 of hTLR9 had the highest affinity for CpG ODN followed by LRR2 and -5, whereas LRR8 had almost no affinity. In vitro, preincubation with LRR11 more significantly decreased CpG ODN internalization, subsequent NF-κB activation, and cytokine release than with LRR2 and -5 in mouse peritoneal macrophages treated with CpG ODN. The LRR11 deletion mutant of hTLR9 conferred decreased cellular responses to CpG ODN. Single- or multiple-site mutants at five positively charged residues of LRR11 (LRR11m1-9), especially Arg-337 and Lys-367, were shown to contribute to hTLR9 binding of CpG ODN. LRR11m1-9 showed reduced inhibition of CpG ODN internalization and CpG ODN/TLR9 signaling, supporting the above findings. Prediction of whole hTLR9 ECD-CpG ODN interactions revealed that Arg-337 and Lys-338 directly contact CpG ODN through hydrogen bonding, whereas Lys-347, Arg-348, and His-353 contribute to stabilizing the shape of the ligand binding region. These findings suggested that although all five positively charged residues within LRR11 contributed to its high affinity, only Arg-337 and Lys-338 directly interacted with CpG ODN. In conclusion, the results suggested that LRR11 could strongly bind to CpG ODN, whereas mutations at the five positively charge residues reduced this high affinity. LRR11 may be further investigated as an antagonist of hTLR9.


Figures

FIGURE 1.
FIGURE 1.
Binding assays of CpG ODN for LRR peptides. A, amino acid sequences of the LRR peptides and URP are shown. B, binding affinity curves of CpG ODN for LRRs are shown. LRR peptides or URP (50 μm) were added into the cuvette of the IAsys biosensor, and each was allowed to bind for 3 min. A single binding curve for each peptide was generated. After the cuvette was washed 3 times with 50 μl of PBS and alternately washed twice with 0.01 m HCl, the data were collected and analyzed using FASTplot. Results from one of three independent experiments are shown. C, KD values of the peptides for CpG ODN are shown. CpG ODN were immobilized on the surface of the sample cuvette. Gradient concentrations of peptides were added into the cuvette to detect the real-time mass changes of peptides specifically binding to CpG ODN. The KD value of each peptide was calculated. Data from one of three independent experiments are shown. D, CD spectral changes of CpG ODN after the addition of the peptides are shown. CD spectral changes of CpG ODN at a concentration of 100 μg/ml in phosphate buffer (pH 7.0) after the addition of peptides are shown. Data shown are the averages of four independent experiments.
FIGURE 2.
FIGURE 2.
Internalization of CpG ODN preincubated with LRR peptides. A, shown is internalization of 6-FAM CpG ODN preincubated with four LRR peptides and URP. Mouse peritoneal macrophages (5 × 10⁵ cells) were plated and incubated on glass coverslips for 4 h. The supernatants were replaced with fresh serum-free medium containing 6-FAM CpG ODN (1.5 μm, abbreviated as 6-FAM CpG) and the peptides (1.5 μm), which had been preincubated for 15 min. After another 10 min of incubation, the cells were triple-washed with PBS, and the fluorescence intensities were examined by laser confocal scanning microscopy. Mean fluorescence intensity values were calculated, and data from one of five independent experiments are shown (mean ± S.D.). **, p < 0.01 versus CpG. B, internalization of 6-FAM CpG ODN preincubated with different concentrations of LRR11 peptide is shown. Mouse peritoneal macrophages were plated and incubated on glass coverslips for 4 h. The supernatants were replaced with fresh serum-free medium containing 6-FAM CpG ODN (1.5 μm, 6-FAM CpG) that had been preincubated with different concentrations of LRR11 peptide (0.5, 1.5, 4.5, 13.5, and 40.5 μm) for 15 min. After another 10-min incubation with the 6-FAM CpG ODN and LRR11 mixture, the cells were examined by laser confocal scanning microscopy, and mean fluorescence intensity values were calculated. Data from one of five independent experiments are shown. C, shown is internalization of 6-FAM CpG ODN incubated with LRR11 peptide and non-labeled CpG ODN (competitive binding experiment). Mouse peritoneal macrophages were plated and incubated on glass coverslips for 4 h. Meanwhile, the peptides (1.5 μm), 6-FAM CpG (1.5 μm), and non-labeled CpG ODN (0.75, 1.5, 3 and 6 μm, abbreviated as CpG) were added to fresh serum-free medium, and then the mixtures were added to cultured cells. After another 10-min incubation, the cells were examined by laser confocal scanning microscopy. Mean fluorescence intensity (MFI) values were calculated, and data from one of five independent experiments are shown.
FIGURE 3.
FIGURE 3.
IκBα degradation and NF-κB activation induced by CpG ODN preincubated with LRR peptides. A, IκBα degradation (lower panel) and NF-κB activation (upper panel) were induced by CpG ODN preincubated with LRRs. CpG ODN (1.5 μm, CpG) and LRRs (1.5 μm) were preincubated for 15 min, and then the mixtures were added to murine peritoneal macrophages (1 × 10⁷ cells). After incubation for 4 h, cells were harvested for extracting cytoplasmic and nuclear proteins. The levels of both NF-κB p50 and p65 in nuclear proteins were tested by ELISA. The level of cytoplasmic IκBα was tested by Western blotting. Data from one of three independent experiments (n = 3) are shown (mean ± S.D.). *, p < 0.05; **, p < 0.01 versus CpG. B, shown are IκBα degradation (lower panel) and NF-κB activation (upper panel) induced by LPS and PAM3 preincubated with LRR11. Experiments were carried out as described in A. The concentrations of URP, LPS, and PAM3CSK4 (PAM3) were 1.5 μm, 50 ng/ml, and 5 μg/ml, respectively. Data from one of three independent experiments (n = 3) are shown (mean ± S.D.). **, p < 0.01 versus CpG. C, IκBα degradation (lower panel) and NF-κB activation (upper panel) induced by CpG ODN preincubated with different concentrations of LRR11 are shown. Experiments were carried out as described in A. LRR11 concentrations were 0.5, 1.5, 4.5, 13.5, and 40.5 μm. IC50 of LRR11 for decreasing NF-κB activation was calculated. Data from one of three independent experiments (n = 3) are shown (mean ± S.D.).
FIGURE 4.
FIGURE 4.
mRNA expression and release of TNF-α, IL-6, and IFN-γ in macrophages. A, mRNA expression and the release of TNF-α (A1), IL-6 (A2), and IFN-γ (A3) induced by CpG ODN preincubated with LRRs are shown. CpG ODN (1.5 μm, CpG) and LRRs (1.5 μm) were incubated for 15 min, and then the mixtures were added to murine peritoneal macrophages (4 × 10⁵ cells). After incubation for 4, 6, and 24 h, the supernatants were collected for assessment of cytokines using corresponding ELISA kits. The cells were harvested for extracting total RNA and subsequent mRNA expression assays by real-time PCR. For each sample, mRNA expression levels for specific transcripts were normalized to β-actin and determined by the 2−ΔΔCT method. Data from one of five independent experiments (n = 3) are shown (mean ± S.D.). The left ordinate represents cytokines release, whereas the right ordinate represents mRNA expression. *, p < 0.05; **, p < 0.01 versus CpG. B, mRNA expression and release of TNF-α (B1), IL-6 (B2), and IFN-γ (B3) induced by LPS or PAM3 preincubated with LRR11 or URP are shown. Experiments were carried out as described in A, except with the addition of LPS or PAM3 treatment. *, p < 0.05; **, p < 0.01 versus CpG. C, shown is mRNA expression and the release of TNF-α (C1), IL-6 (C2) and IF N-γ (C3) induced by CpG ODN preincubated with different concentrations of LRR11. Experiments were carried out as described in A, except with different concentrations (0.5, 1.5, 4.5, 13.5, and 40.5 μm) of LRR11. IC50 values of LRR11 for TNF-α, IL-6, and IFN-γ were calculated, and data from one of three independent experiments (n = 3) are shown (mean ± S.D.).
FIGURE 5.
FIGURE 5.
IκB-α degradation, mRNA expression, and release of TNF-α from HEK293T cells expressing TLR9-WT or TLR9-del_LRR11. A, hTLR9 expression in the transduced HEK293T cells was tested by Western blotting. B, IκB-α degradation and NF-κB activation in the transduced HEK293T cells treated with or without CpG ODN (1.5 μm) were tested using Western blotting. **, p < 0.01 versus TLR9-WT. Data from one of two independent experiments (n = 3) are shown (mean ± S.D.). C, mRNA expression and release of TNF-α from transduced HEK293T cells treated without or with CpG ODN (1.5 μm) were tested using real-time PCR and ELISA, respectively. **, p < 0.01 versus TLR9-WT. One of two independent experiments (n = 3) is shown (mean ± S.D.).
FIGURE 6.
FIGURE 6.
Binding affinity of CpG ODN for LRR11m1–9. A, shown are amino acid sequences of LRR11ms. The mutated sites of LRR11 are in underlined and bold italic letters. B, surface charge computation of parent/wild-type (WT) or mutant LRR11 within hTLR9 is shown. Surface charge computation was conducted using the APBS package and represented in PyMOL. Red, negatively charged region; blue, positively charged region. C, binding affinity curves of CpG ODN for LRR11m1–9 are shown. Experiments were carried out as described in Fig. 1B. Data from one of five independent experiments are shown.
FIGURE 7.
FIGURE 7.
Internalization of CpG ODN preincubated with LRR11m1–9 peptides. Experiments were carried out as described in Fig. 2. Data from one of five independent experiments are shown (mean ± S.D.). *, p < 0.05; **, p < 0.01 versus CpG; †, p < 0.05; ‡, p < 0.01 versus CpG + LRR11. MFI, mean fluorescence intensity.
FIGURE 8.
FIGURE 8.
IκBα degradation and NF-κB activation induced by CpG ODN preincubated with LRR11m1–9. Experiments were carried out as described in Fig. 3. Data from one of five independent experiments (n = 3) are shown (mean ± S.D.). **, p < 0.01 versus CpG; †, p < 0.05; ‡, p < 0.01 versus CpG + LRR11.
FIGURE 9.
FIGURE 9.
Release of cytokines induced by CpG ODN preincubated with LRR11m1–9. Experiments were carried out as described in Fig. 4. Data from one of five independent experiments (n = 3) are shown (mean ± S.D.). *, p < 0.05; **, p < 0.01 versus CpG; †, p < 0.05; ‡, p < 0.01 versus CpG + LRR11.
FIGURE 10.
FIGURE 10.
Proposed hTLR9 ECD-CpG ODN complex. A, Arg-337 and Lys-338 are in close contact with CpG ODN. The hTLR9 ECD is shown in the diagram, with LRR11 highlighted in purple. CpG ODN are shown in rainbow sticks. Arg-337, Lys-367, Lys-347, Arg-348, and His-353 are indicated in sticks. In the close-up views of interactions between LRR11 and CpG ODN, LRR11 is depicted in cyan sticks. The N terminus (NT) and C terminus (CT) of hTLR9 ECD are indicated. B, shown are hydrogen bonding interactions of the computed hTLR9 ECD-CpG ODN complex. The hydrogen bonds are represented as black dotted lines, and the distances of hydrogen bonds (Å) between the donor and receptor are indicated.

Similar articles

Cited by

References

    1. Akira S., Uematsu S., Takeuchi O. (2006) Pathogen recognition and innate immunity. Cell 124, 783–801 - PubMed
    1. Uematsu S., Akira S. (2007) Toll-like receptors and Type I interferons. J. Biol. Chem. 282, 15319–15323 - PubMed
    1. Jin M. S., Lee J. O. (2008) Structures of TLR-ligand complexes. Curr. Opin Immunol. 20, 414–419 - PubMed
    1. Akira S., Takeda K. (2004) Toll-like receptor signalling. Nat. Rev. Immunol. 4, 499–511 - PubMed
    1. Bell J. K., Mullen G. E., Leifer C. A., Mazzoni A., Davies D. R., Segal D. M. (2003) Leucine-rich repeats and pathogen recognition in Toll-like receptors. Trends Immunol. 24, 528–533 - PubMed

Publication types

LinkOut - more resources