

Biochemical analysis of hypermutation by the deoxycytidine deaminase APOBEC3A
- PMID: 22822074
- PMCID: PMC3436324
- DOI: 10.1074/jbc.M112.393181
Biochemical analysis of hypermutation by the deoxycytidine deaminase APOBEC3A
Abstract
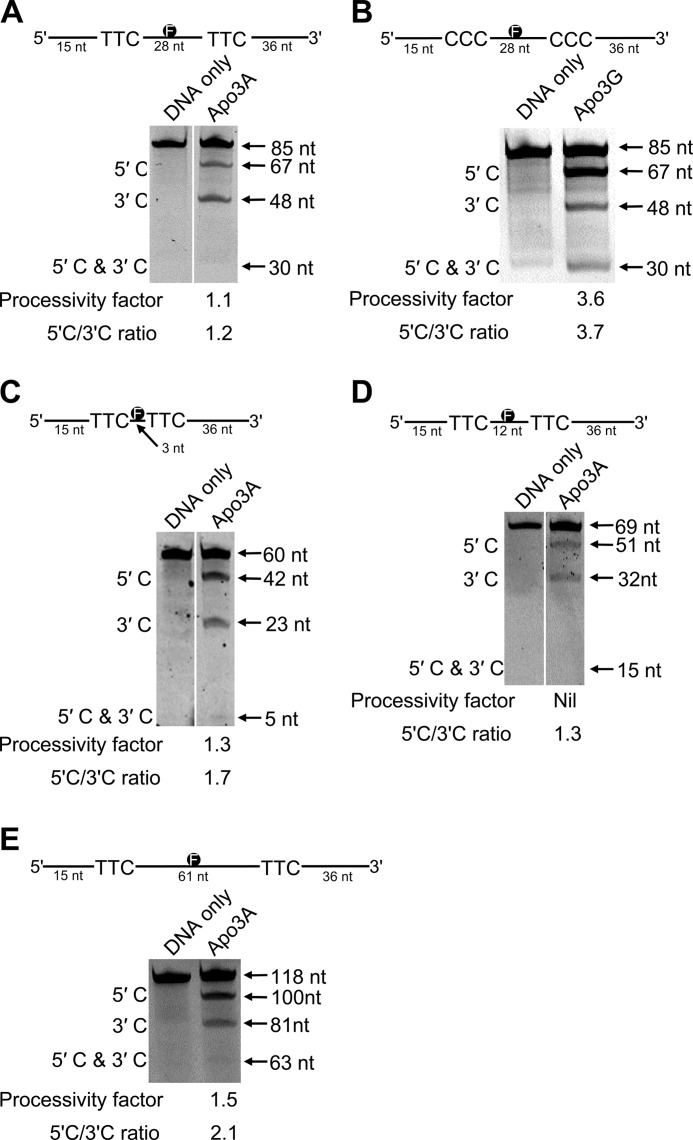
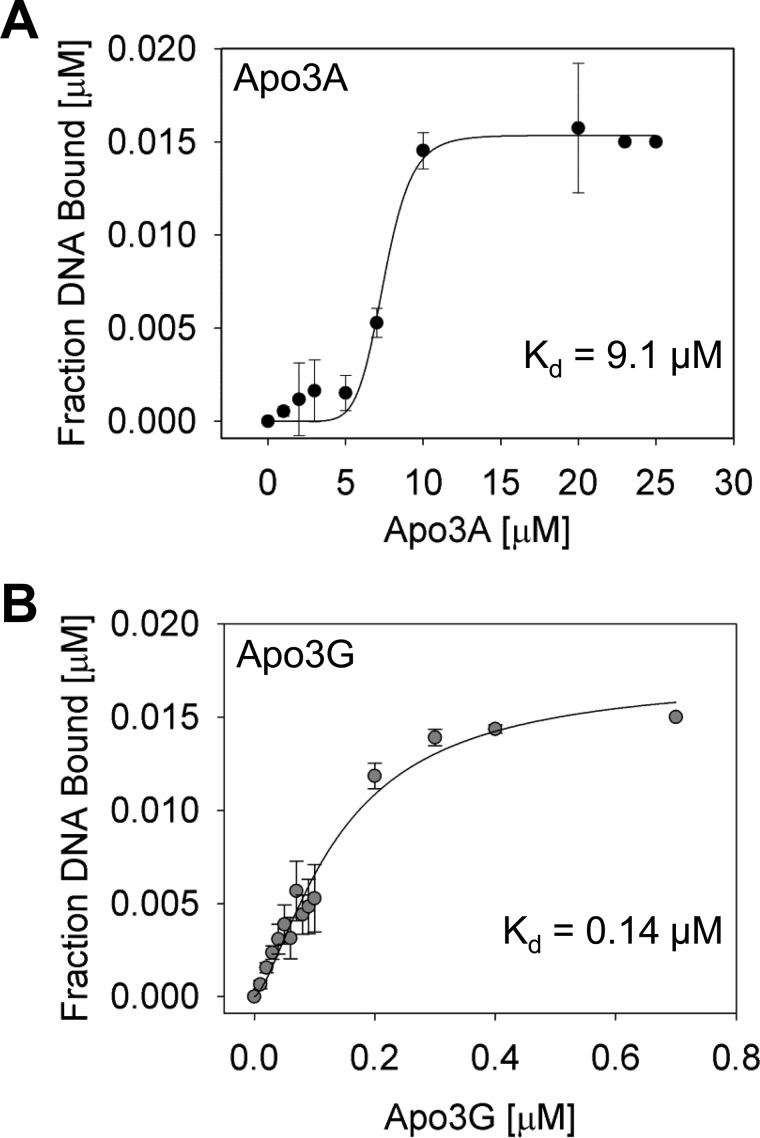
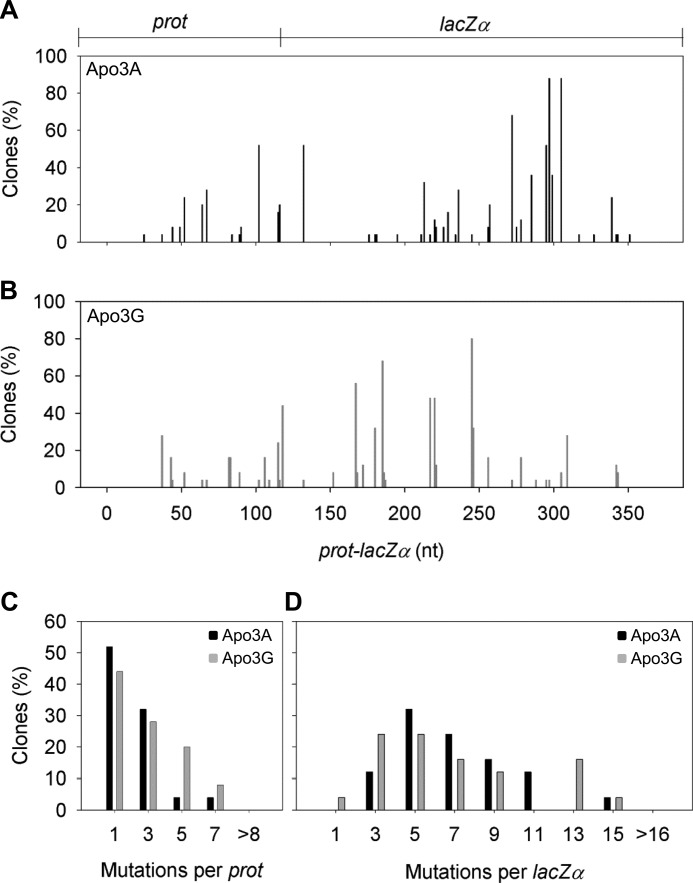
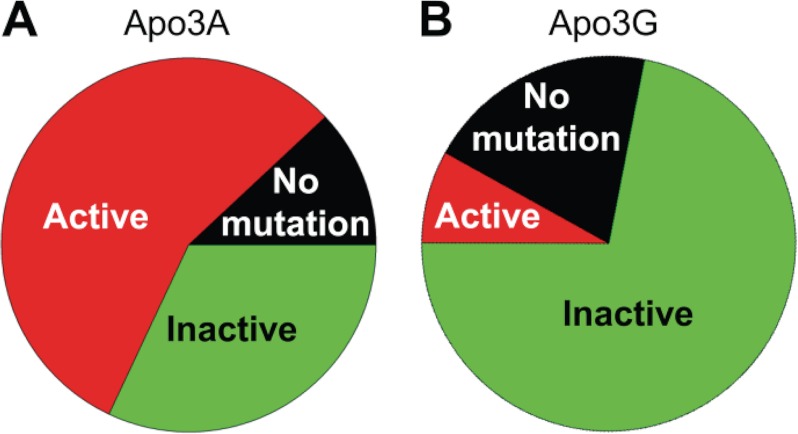
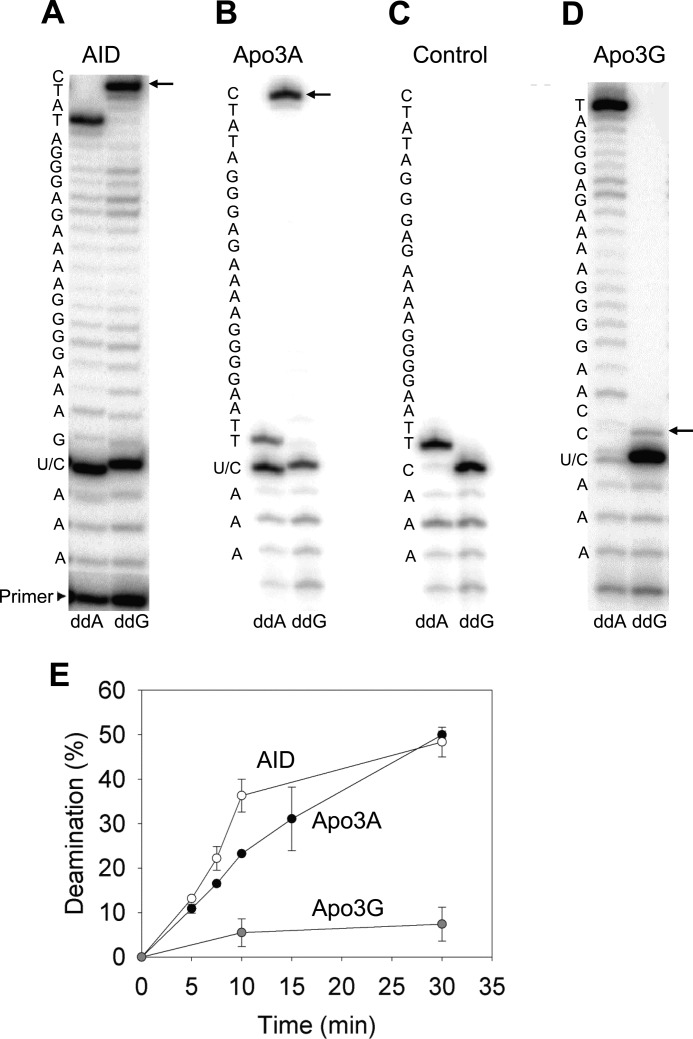
APOBEC3A belongs to a family of single-stranded DNA (ssDNA) DNA cytosine deaminases that are known for restriction of HIV through deamination-induced mutational inactivation, e.g. APOBEC3G, or initiation of somatic hypermutation and class switch recombination (activation-induced cytidine deaminase). APOBEC3A, which is localized to both the cytoplasm and nucleus, not only restricts HIV but can also initiate catabolism of cellular DNA. Despite being ascribed these roles, there is a paucity of data available on the biochemical mechanism by which APOBEC3A deaminates ssDNA. Here we assessed APOBEC3A deamination activity on ssDNA and in dynamic systems modeling HIV replication (cytoplasmic event) and DNA transcription (nuclear event). We find that APOBEC3A, unlike the highly processive APOBEC3G, exhibits low or no processivity when deaminating synthetic ssDNA substrates with two cytosines located 5-63 nucleotides apart, likely because of an apparent K(d) in the micromolar range (9.1 μm). APOBEC3A was able to deaminate nascently synthesized (-)DNA in an in vitro model HIV replication assay but induced fewer mutations overall in comparison to APOBEC3G. However, the data indicate that the target deamination motif (5'-TC for APOBEC3A and 5'-CC for APOBEC3G) and not the number of mutations best predicted the ability to mutationally inactivate HIV. We further assessed APOBEC3A for the ability to deaminate dsDNA undergoing transcription, which could allow for collateral deaminations to occur in genomic DNA similar to the action of activation-induced cytidine deaminase. That APOBEC3A was able to deaminate dsDNA undergoing transcription suggests a genomic cost of a deamination-based retroviral restriction system.
Figures
Similar articles
-
Intensity of deoxycytidine deamination of HIV-1 proviral DNA by the retroviral restriction factor APOBEC3G is mediated by the noncatalytic domain.J Biol Chem. 2011 Apr 1;286(13):11415-26. doi: 10.1074/jbc.M110.199604. Epub 2011 Feb 7. J Biol Chem. 2011. PMID: 21300806 Free PMC article.
-
HIV-1 viral infectivity factor (Vif) alters processive single-stranded DNA scanning of the retroviral restriction factor APOBEC3G.J Biol Chem. 2013 Mar 1;288(9):6083-94. doi: 10.1074/jbc.M112.421875. Epub 2013 Jan 11. J Biol Chem. 2013. PMID: 23316055 Free PMC article.
-
Different mutagenic potential of HIV-1 restriction factors APOBEC3G and APOBEC3F is determined by distinct single-stranded DNA scanning mechanisms.PLoS Pathog. 2014 Mar 20;10(3):e1004024. doi: 10.1371/journal.ppat.1004024. eCollection 2014 Mar. PLoS Pathog. 2014. PMID: 24651717 Free PMC article.
-
AID and Apobec3G haphazard deamination and mutational diversity.Cell Mol Life Sci. 2013 Sep;70(17):3089-108. doi: 10.1007/s00018-012-1212-1. Epub 2012 Nov 22. Cell Mol Life Sci. 2013. PMID: 23178850 Free PMC article. Review.
-
[Recent advances in the study of mechanism of APOBEC3G against virus].Yao Xue Xue Bao. 2014 Jan;49(1):30-6. Yao Xue Xue Bao. 2014. PMID: 24783502 Review. Chinese.
Cited by
-
Nuclear Magnetic Resonance Structure of the APOBEC3B Catalytic Domain: Structural Basis for Substrate Binding and DNA Deaminase Activity.Biochemistry. 2016 May 31;55(21):2944-59. doi: 10.1021/acs.biochem.6b00382. Epub 2016 May 19. Biochemistry. 2016. PMID: 27163633 Free PMC article.
-
HIV restriction factor APOBEC3G binds in multiple steps and conformations to search and deaminate single-stranded DNA.Elife. 2019 Dec 18;8:e52649. doi: 10.7554/eLife.52649. Elife. 2019. PMID: 31850845 Free PMC article.
-
Interaction of APOBEC3A with DNA assessed by atomic force microscopy.PLoS One. 2014 Jun 6;9(6):e99354. doi: 10.1371/journal.pone.0099354. eCollection 2014. PLoS One. 2014. PMID: 24905100 Free PMC article.
-
Unraveling the Enzyme-Substrate Properties for APOBEC3A-Mediated RNA Editing.J Mol Biol. 2023 Sep 1;435(17):168198. doi: 10.1016/j.jmb.2023.168198. Epub 2023 Jul 11. J Mol Biol. 2023. PMID: 37442413 Free PMC article.
-
Mesoscale DNA features impact APOBEC3A and APOBEC3B deaminase activity and shape tumor mutational landscapes.Nat Commun. 2024 Mar 18;15(1):2370. doi: 10.1038/s41467-024-45909-5. Nat Commun. 2024. PMID: 38499542 Free PMC article.
References
-
- Sheehy A. M., Gaddis N. C., Choi J. D., Malim M. H. (2002) Isolation of a human gene that inhibits HIV-1 infection and is suppressed by the viral Vif protein. Nature 418, 646–650 - PubMed
-
- Harris R. S., Bishop K. N., Sheehy A. M., Craig H. M., Petersen-Mahrt S. K., Watt I. N., Neuberger M. S., Malim M. H. (2003) DNA deamination mediates innate immunity to retroviral infection. Cell 113, 803–809 - PubMed
-
- Mangeat B., Turelli P., Caron G., Friedli M., Perrin L., Trono D. (2003) Broad antiretroviral defense by human APOBEC3G through lethal editing of nascent reverse transcripts. Nature 424, 99–103 - PubMed
-
- Chiu Y. L., Greene W. C. (2008) The APOBEC3 cytidine deaminases. An innate defensive network opposing exogenous retroviruses and endogenous retroelements. Annu. Rev. Immunol. 26, 317–353 - PubMed
Publication types
MeSH terms
Substances
Grants and funding
LinkOut - more resources
Full Text Sources
