. 2012 Sep 21;287(39):32967-80.
doi: 10.1074/jbc.M112.400663. Epub 2012 Jul 21.

Protein carbonylation and adipocyte mitochondrial function

Affiliations

Protein carbonylation and adipocyte mitochondrial function

Jessica M Curtis et al. J Biol Chem. .

Abstract

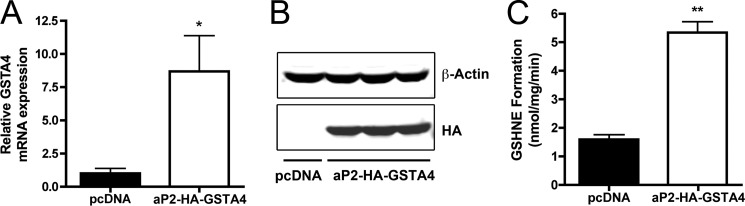
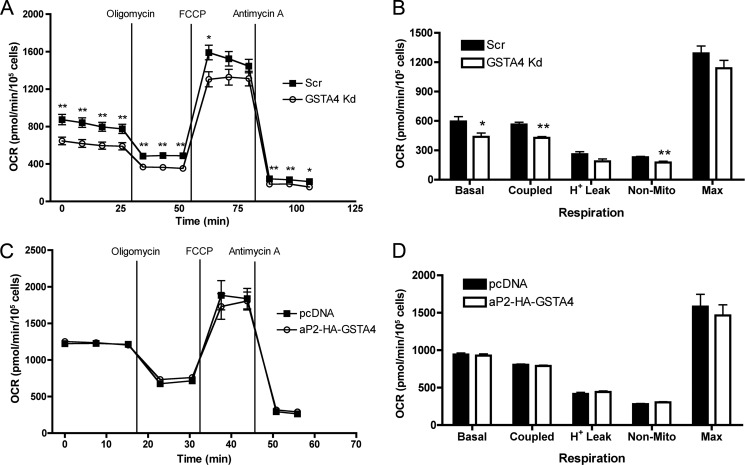
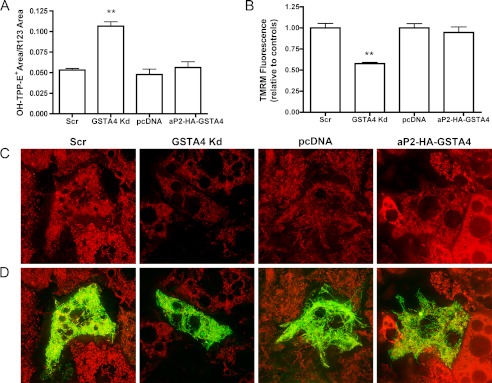
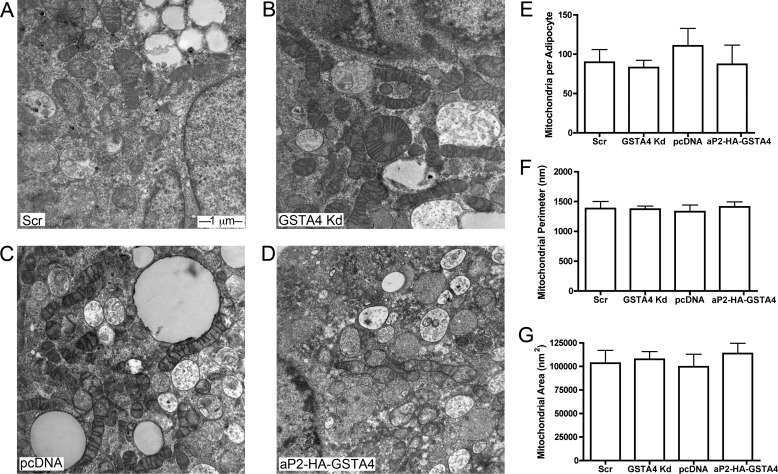
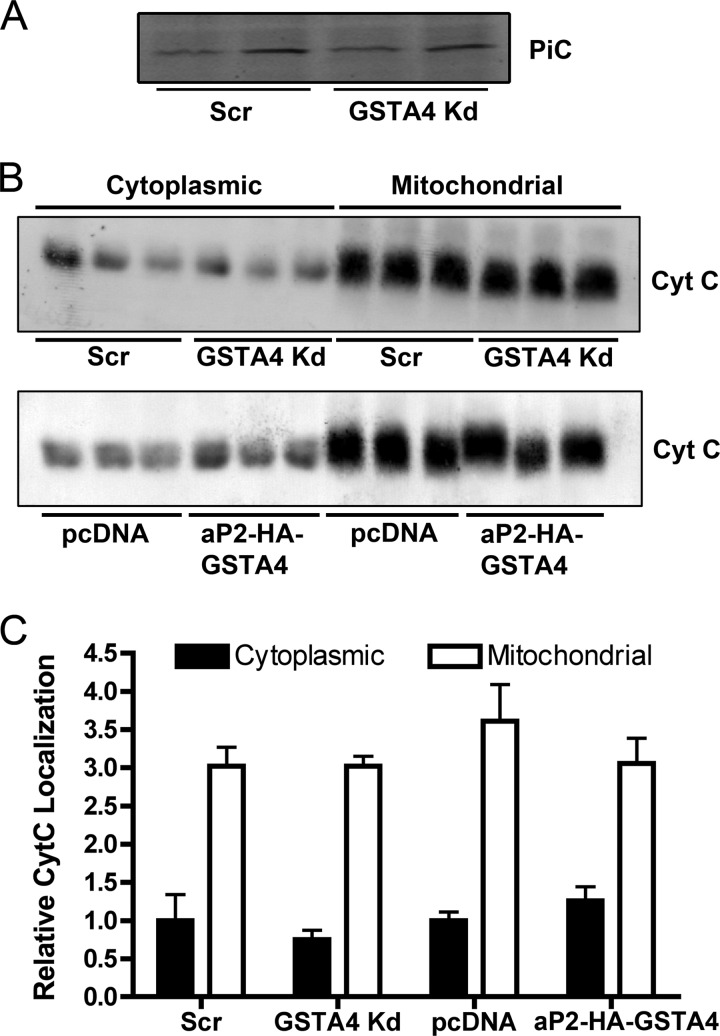
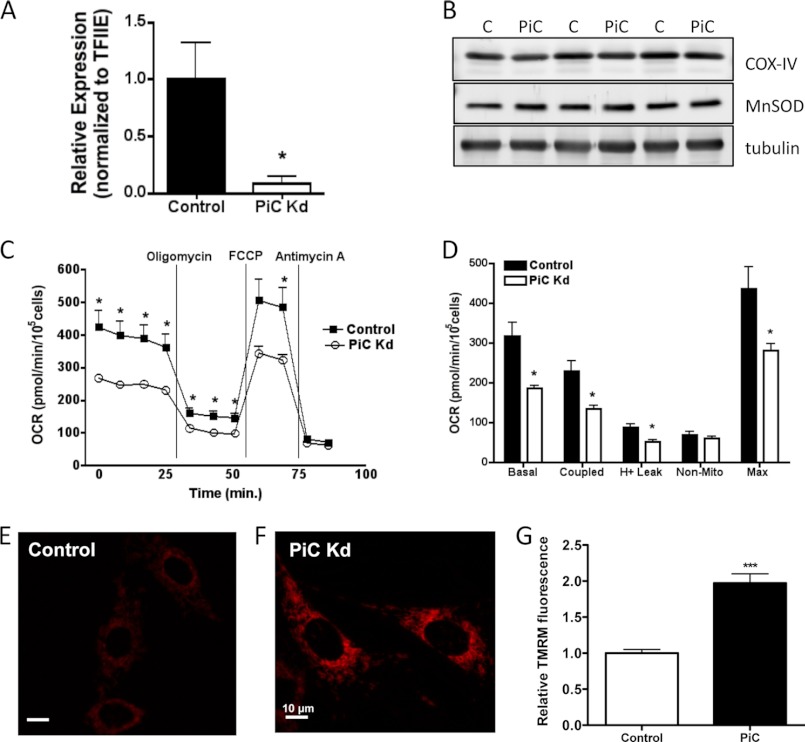
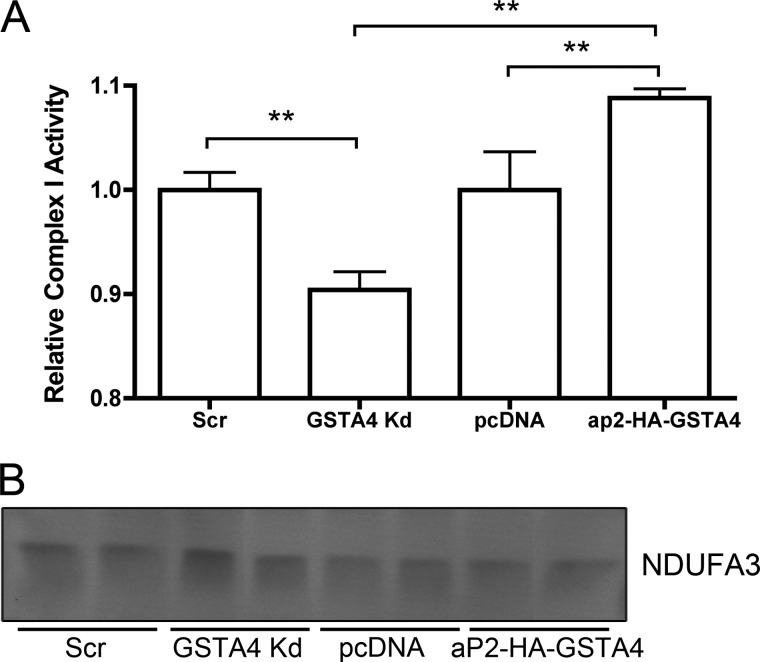
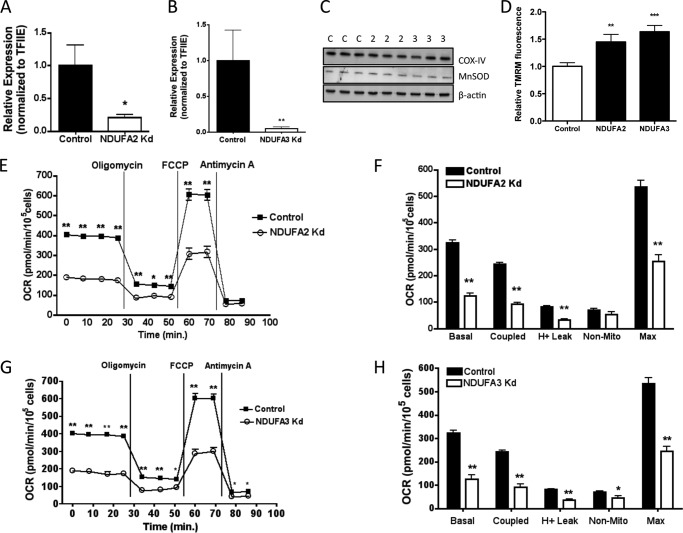
Carbonylation is the covalent, non-reversible modification of the side chains of cysteine, histidine, and lysine residues by lipid peroxidation end products such as 4-hydroxy- and 4-oxononenal. In adipose tissue the effects of such modifications are associated with increased oxidative stress and metabolic dysregulation centered on mitochondrial energy metabolism. To address the role of protein carbonylation in the pathogenesis of mitochondrial dysfunction, quantitative proteomics was employed to identify specific targets of carbonylation in GSTA4-silenced or overexpressing 3T3-L1 adipocytes. GSTA4-silenced adipocytes displayed elevated carbonylation of several key mitochondrial proteins including the phosphate carrier protein, NADH dehydrogenase 1α subcomplexes 2 and 3, translocase of inner mitochondrial membrane 50, and valyl-tRNA synthetase. Elevated protein carbonylation is accompanied by diminished complex I activity, impaired respiration, increased superoxide production, and a reduction in membrane potential without changes in mitochondrial number, area, or density. Silencing of the phosphate carrier or NADH dehydrogenase 1α subcomplexes 2 or 3 in 3T3-L1 cells results in decreased basal and maximal respiration. These results suggest that protein carbonylation plays a major instigating role in cytokine-dependent mitochondrial dysfunction and may be linked to the development of insulin resistance in the adipocyte.


Figures

FIGURE 1.
FIGURE 1.
Expression and functionality of aP2-HA-GSTA4 in 3T3-L1 adipocytes. A, relative mRNA expression of GSTA4 in control (pcDNA) and overexpressing (aP2-HA-GSTA4) adipocytes normalized to TFIIE is shown. B, expression of HA-GSTA4 (anti-HA) relative to β-actin (anti-actin) in separate overexpressing cell lines is shown. C, an in vitro GS-HNE formation assay is shown (n = 3; *, p < 0.05; **, p < 0.01).
FIGURE 2.
FIGURE 2.
Oxygen consumption rates in GSTA4-silenced and -overexpressing adipocytes. A and C, shown are cellular oxygen consumption rates (OCR) for scrambled control (Scr) and GSTA4 Kd (A) and control (pcDNA) and GSTA4 overexpressing (aP2-HA-GSTA4) (C) adipocytes as measured by XF24 extracellular flux analysis. Oligomycin (50 μg/ml), carbonyl cyanide 4-(trifluoromethoxy) phenylhydrazone (FCCP, 4 μm), and antimycin A (2.5 μm) were injected at the indicated time points. B and D, respiration rates as determined from A and C are shown. (n = 5–10; *, p < 0.05; **, p < 0.01).
FIGURE 3.
FIGURE 3.
Mitochondrial superoxide production and membrane potential. A, mitochondrial superoxide anion production normalized to rhodamine 123 membrane potential control (n = 4). B, TMRM fluorescence using ImageJ (n = 10 frames) is shown. C, TMRM staining of 3T3-L1 adipocytes is shown. D, merge of TMRM with mitochondrial targeted GFP localization control is shown is shown. (**, p < 0.01).
FIGURE 4.
FIGURE 4.
Mitochondrial number and area by electron microscopy. A–D, electron micrographs at 30,000× magnification of scrambled (A), GSTA4 Kd (B), pcDNA (C), and aP2-HA-GSTA4 (D) 3T3-L1 adipocytes are shown. E and F, quantitation of mitochondrial number (E), perimeter (F), and area (G) from multiple fields (n = 70–100 each) is shown.
FIGURE 5.
FIGURE 5.
PiC protein abundance and cytochrome C localization in GSTA4-silenced and overexpressing 3T3-L1 adipocytes. A, shown is immunoblot analysis of PiC. B, immunolocalization of Cyt C protein in 3T3-L1 adipocyte cytoplasmic and mitochondrial fractions is shown. C, quantitation of immunoblots from B is shown.
FIGURE 6.
FIGURE 6.
Properties of PiC-silenced 3T3-L1 cells. A, shown is relative mRNA expression of the mitochondrial phosphate carrier in control and PiC-silenced (PiC Kd) fibroblasts normalized to TFIIE. B, expression of mitochondrial proteins cytochrome c oxidase complex IV (COX-IV) and manganese superoxide dismutase (MnSOD) in PiC-silenced 3T3-L1 cells is shown. C and D, cellular oxygen consumption rates for control and PiC-silenced cells. E and F, TMRM fluorescence (n = 30 frames, ∼ 150 cells) and G, quantitation using Image J of control and PiC-silenced cells are shown. (*, p < 0.05; ***, p < 0.001).
FIGURE 7.
FIGURE 7.
Complex I activity in isolated mitochondria. A, the Complex I-dependent reduction of dichlorophenolindolephenol was monitored spectrophotometrically at 595 nm in isolated mitochondria (n = 4; ** p < 0.01). B, protein expression of NDUFA3 Complex I subunit in mitochondrial fractions (representative blot, n = 6) is shown.
FIGURE 8.
FIGURE 8.
Properties of NDUFA2- and NDUFA3-silenced 3T3-L1 cells. A and B, shown is relative mRNA expression of NDUFA2 (A) and NDUFA3 (B) in control and silenced (Kd) fibroblasts normalized to TFIIE. C, expression of cytochrome c oxidase complex IV (COX-IV) and manganese superoxide dismutase (MnSOD) protein in control (C) and NDUFA2 (2)- and NDUFA3 (3)- silenced cells. D, TMRM fluorescence (n = 30 frames, ∼150 cells) and quantitation using Image J of control and NDUFA2- and NDUFA3-silenced cells are shown. E–H, cellular oxygen consumption rates for control and NDUFA2- and NDUFA3-silenced cells are shown. Details of experiment as in legend to Fig. 2. (*, p < 0.05; **, p < 0.01; ***, p < 0.001).

Similar articles

Cited by

References

    1. Bonadonna R. C., Groop L., Kraemer N., Ferrannini E., Del Prato S., DeFronzo R. A. (1990) Obesity and insulin resistance in humans. A dose-response study. Metab. Clin. Exp. 39, 452–459 - PubMed
    1. Furukawa S., Fujita T., Shimabukuro M., Iwaki M., Yamada Y., Nakajima Y., Nakayama O., Makishima M., Matsuda M., Shimomura I. (2004) Increased oxidative stress in obesity and its impact on metabolic syndrome. J. Clin. Invest. 114, 1752–1761 - PMC - PubMed
    1. Houstis N., Rosen E. D., Lander E. (2006) Reactive oxygen species have a causal role in multiple forms of insulin resistance. Nature 440, 944–948 - PubMed
    1. Fang J., Holmgren A. (2006) Inhibition of thioredoxin and thioredoxin reductase by 4-hydroxy-2-nonenal in vitro and in vivo. J. Am. Chem. Soc. 128, 1879–1885 - PubMed
    1. Sharma R., Sharma A., Dwivedi S., Zimniak P., Awasthi S., Awasthi Y. C. (2008) 4-Hydroxynonenal self-limits fas-mediated DISC-independent apoptosis by promoting export of Daxx from the nucleus to the cytosol and its binding to Fas. Biochemistry 47, 143–156 - PMC - PubMed

Publication types

Substances

LinkOut - more resources