

doi: 10.1126/science.1166794.
Response to Comment on "Dynamic Shifts of Limited Working Memory Resources in Human Vision"
Affiliations
- PMID: 22822271
- PMCID: PMC3400944
- DOI: 10.1126/science.1166794
Item in Clipboard
Response to Comment on "Dynamic Shifts of Limited Working Memory Resources in Human Vision"
Science.
.
Abstract
Cowan & Rouder suggest that a modification to the four-slot model of visual working memory fits the available data better than our distributed resource model. However their comparisons of statistical fit are biased in favour of the slot model. Here we compare the predictions of the two models and present further evidence against the division of visual memory into slots.
Figures
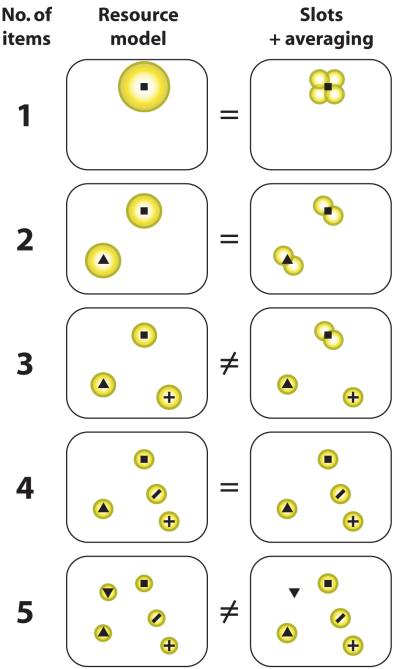
Allocation of visual working memory under the resource model (7) and the slots + averaging model (8). In the resource model (left), a common memory resource (yellow) is shared out between multiple visual items (black symbols): larger circles indicate greater resources dedicated to representing an item in memory, and so greater precision on subsequent recall. In the slots + averaging model (right), memory is divided into discrete slots (here four) of equal resolution (yellow circles), and multiple slots can combine to represent an item with increased precision. The two models make equivalent predictions for one, two and four items. For three items, slots must be allocated unevenly in the slots + averaging model, so that one item is stored with greater precision than the others. When the number of items exceeds the number of slots, the slots + averaging model predicts that no information will be stored about items without a slot.
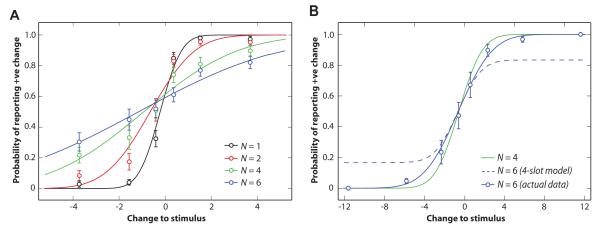
(A) Combined performance on location and orientation memory tasks as reported in (7). On each trial, N items were presented then briefly blanked; one item reappeared changed in either location or orientation and subjects had to indicate the direction of change. Gaze was monitored to ensure fixation was maintained. Stimulus change is plotted relative to the standard deviation of the N = 1 response function (σ0 in (9)). Curves represent the maximum-likelihood fit of the resource model defined by Eq. 1 in (9). (B) New data from four subjects on the location memory task with an extended range of displacements (up to 10° of visual angle, corresponding to > 11σ0). The green line indicates the slope of the mean response function for four items. The blue dashed line represents the N = 6 response function predicted by an item-limit model with four slots. Blue solid line and symbols indicate the actual N = 6 response function (error bars represent ±1 SE).
References
Grants and funding
LinkOut - more resources
Full Text Sources
