

Dried blood spots and sparse sampling: a practical approach to estimating pharmacokinetic parameters of caffeine in preterm infants
- PMID: 22822712
- PMCID: PMC3575947
- DOI: 10.1111/j.1365-2125.2012.04392.x
Dried blood spots and sparse sampling: a practical approach to estimating pharmacokinetic parameters of caffeine in preterm infants
Abstract
Aims: Dried blood spots (DBS) alongside micro-analytical techniques are a potential solution to the challenges of performing pharmacokinetic (PK) studies in children. However, DBS methods have received little formal evaluation in clinical settings relevant to children. The aim of the present study was to determine a PK model for caffeine using a 'DBS/microvolume platform' in preterm infants.
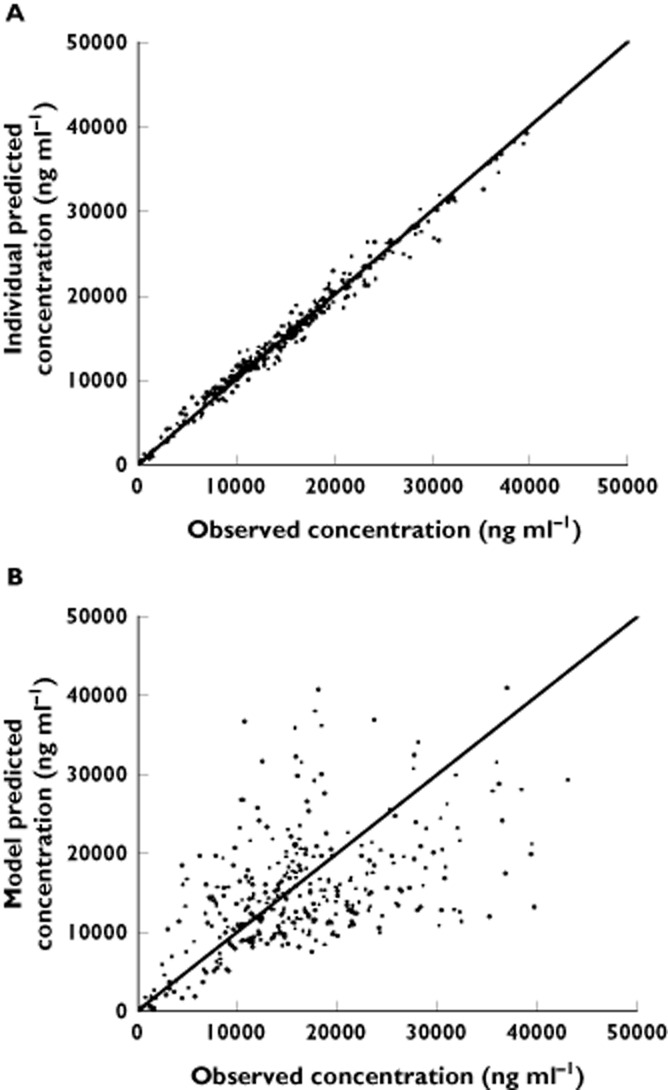
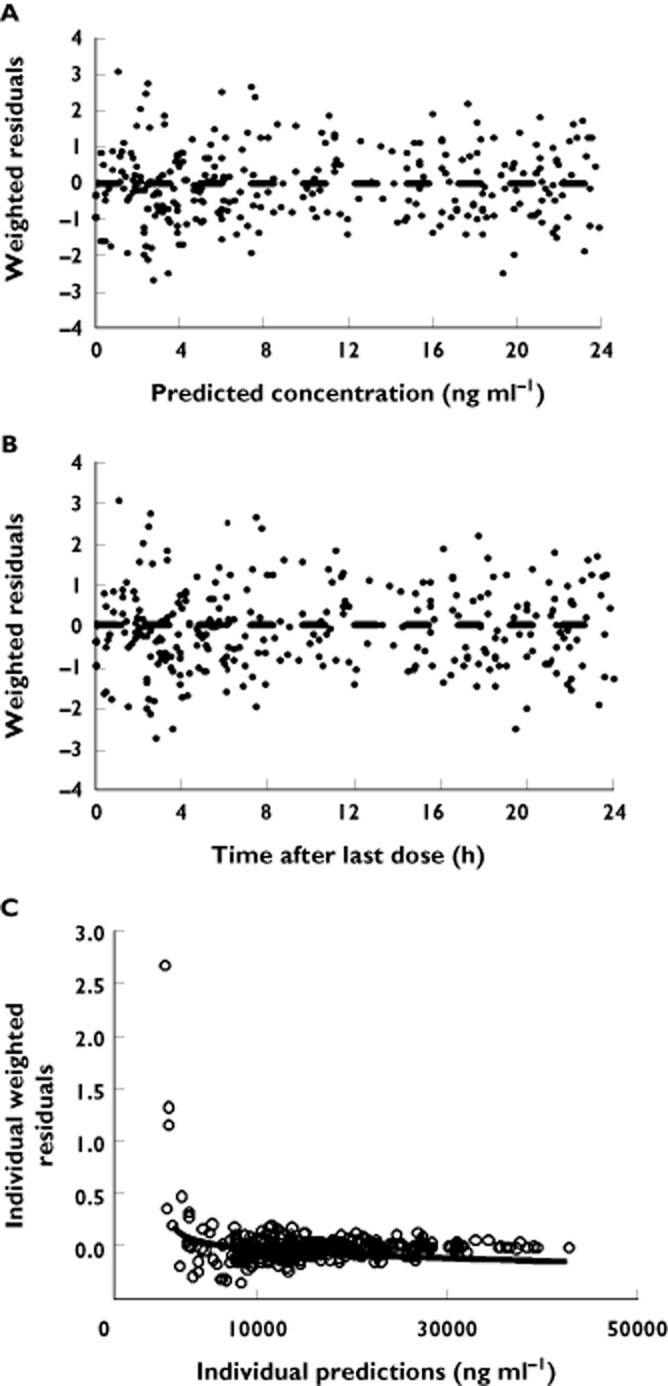
Methods: DBS samples were collected prospectively from premature babies receiving caffeine for treatment of apnoea of prematurity. A non-linear mixed effects approach was used to develop a population PK model from measured DBS caffeine concentrations. Caffeine PK parameter estimates based on DBS data were then compared with plasma estimates for agreement.
Results: Three hundred and thirty-eight DBS cards for caffeine measurement were collected from 67 preterm infants (birth weight 0.6-2.11 kg). 88% of cards obtained were of acceptable quality and no child had more than 10 DBS samples or more than 0.5 ml of blood taken over the study period. There was good agreement between PK parameters estimated using caffeine concentrations from DBS samples (CL = 7.3 ml h⁻¹ kg⁻¹; V = 593 ml kg⁻¹; t(½) = 57 h) and historical caffeine PK parameter estimates based on plasma samples (CL = 4.9-7.9 ml h⁻¹ kg⁻¹; V = 640-970 ml kg⁻¹; t(½) = 101-144 h). We also found that changes in blood haematocrit may significantly confound estimates of caffeine PK parameters based on DBS data.
Conclusions: This study demonstrates that DBS methods can be applied to PK studies in a vulnerable population group and are a practical alternative to wet matrix sampling techniques.
© 2012 The Authors. British Journal of Clinical Pharmacology © 2012 The British Pharmacological Society.
Figures
Similar articles
-
Prediction of pharmacokinetic values of two various dosages of caffeine in premature neonates with apnea.Indian J Pharmacol. 2021 Mar-Apr;53(2):108-114. doi: 10.4103/ijp.IJP_504_19. Indian J Pharmacol. 2021. PMID: 34100394 Free PMC article.
-
DBS-LC-MS/MS assay for caffeine: validation and neonatal application.Bioanalysis. 2016 Sep;8(18):1893-902. doi: 10.4155/bio-2016-0127. Epub 2016 Aug 17. Bioanalysis. 2016. PMID: 27532249
-
From "wet" matrices to "dry" blood spot sampling strategy: a versatile LC-MS/MS assay for simultaneous monitoring caffeine and its three primary metabolites in preterm infants.Clin Chem Lab Med. 2023 Jul 13;62(1):97-110. doi: 10.1515/cclm-2023-0310. Print 2024 Jan 26. Clin Chem Lab Med. 2023. PMID: 37435827
-
A comprehensive review of caffeine population pharmacokinetics in preterm infants: Factors affecting clearance.Eur J Pharm Biopharm. 2025 Mar;208:114659. doi: 10.1016/j.ejpb.2025.114659. Epub 2025 Feb 4. Eur J Pharm Biopharm. 2025. PMID: 39914572 Review.
-
The use of mass spectrometry to analyze dried blood spots.Mass Spectrom Rev. 2016 May-Jun;35(3):361-438. doi: 10.1002/mas.21441. Epub 2014 Sep 22. Mass Spectrom Rev. 2016. PMID: 25252132 Review.
Cited by
-
Dosing in neonates: special considerations in physiology and trial design.Pediatr Res. 2015 Jan;77(1-1):2-9. doi: 10.1038/pr.2014.143. Epub 2014 Sep 30. Pediatr Res. 2015. PMID: 25268145 Free PMC article. Review.
-
Caffeine for the Pharmacological Treatment of Apnea of Prematurity in the NICU: Dose Selection Conundrum, Therapeutic Drug Monitoring and Genetic Factors.Front Pharmacol. 2021 Jul 26;12:681842. doi: 10.3389/fphar.2021.681842. eCollection 2021. Front Pharmacol. 2021. PMID: 34381359 Free PMC article. Review.
-
Enhanced stability of blood matrices using a dried sample spot assay to measure human butyrylcholinesterase activity and nerve agent adducts.Anal Chem. 2015 Jun 2;87(11):5723-9. doi: 10.1021/acs.analchem.5b00893. Epub 2015 May 20. Anal Chem. 2015. PMID: 25955132 Free PMC article.
-
Advances in Instrumental Analysis of Brominated Flame Retardants: Current Status and Future Perspectives.Int Sch Res Notices. 2014 Oct 28;2014:651834. doi: 10.1155/2014/651834. eCollection 2014. Int Sch Res Notices. 2014. PMID: 27433482 Free PMC article. Review.
-
Utility, promise, and limitations of liquid chromatography-mass spectrometry-based therapeutic drug monitoring in precision medicine.J Mass Spectrom. 2021 Nov;56(11):e4788. doi: 10.1002/jms.4788. Epub 2021 Nov 4. J Mass Spectrom. 2021. PMID: 34738286 Free PMC article. Review.
References
-
- Patel P. 2011. An investigation into the use of dried blood spot analysis in pharmacokinetic studies. PhD Thesis, De Montfort University, Leicester. Available at www.dora.dmu.ac.uk/bitstream/handle/2086/5999/e‐thesis.pdf?sequence=1 (accessed 30 January 2013).
-
- Ziemniak C, George‐Agwu A, Moss WJ, Ray SC, Persaud DA. Sensitive genotyping assay for detection of drug resistance mutations in reverse transcriptase of HIV‐1 subtypes B and C in samples stored as dried blood spots or frozen RNA extracts. J Virol Methods. 2006;136:238–247. - PubMed
-
- Mwaba P, Cassol S, Nunn A, Pilon R, Chintu C, Janes M, Zumla A. Whole blood versus plasma spots for measurement of HIV‐1 viral load in HIV‐infectedafrican patients. Lancet. 2003;362:2067–2068. - PubMed
-
- Mei JV, Alexander JR, Adam BW, Hannon WH. Use of filter paper for the collection and analysis of human whole blood specimens. J Nutr. 2001;131:1631S–1636. - PubMed
-
- Keevil BG. The analysis of dried blood spot samples using liquid chromatography tandem mass spectrometry. Clin Biochem. 2011;44:110–118. - PubMed
MeSH terms
Substances
LinkOut - more resources
Full Text Sources
Other Literature Sources
Medical
